Another EMA trend indicator"Another EMA Trend Indicator" is a dynamic trend-following tool. Blending customizable Moving Averages (EMA or SMA) with an automated, visualized trade management system. It identifies bullish and bearish trend shifts based on short- and long-term MA crossovers, dynamically calculates optimal entry points, stop-losses, and take-profits, and visually manages trades on the chart with optional clouds, lines, and labels.
Main Features:
Moving Average Trend Detection:
Choice between EMA (Exponential Moving Average) or SMA (Simple Moving Average).
Two customizable lengths: a short MA and a long MA.
Detects bullish and bearish switches based on MA crossover events.
Entry, SL, and TP Calculation:
Entries are calculated dynamically after a signal using a combination of historical candle high/low analysis and a risk divider.
Stop-loss and take-profit levels are automatically set based on the trend's recent volatility and user-defined risk parameters.
Supports fixed or dynamic profit targets.
Risk Management Settings:
Define minimum and maximum acceptable profit percentages.
Set maximum stop-loss distance and apply a stop-loss multiplier for added flexibility.
Limit maximum trade duration to avoid endless open trades.
Trade Visualization:
Optional debug mode to display:
Entry, stop-loss, and take-profit lines.
Buy/sell signals via shapes on the chart.
Trend cloud between short and long MAs.
Historical trend levels for better visualization.
Dynamic Statistics Panel:
Real-time display of:
First trade date.
Total number of trades.
Number of profitable and losing trades.
Average and maximum trade duration.
Win rate and average profit/loss percentages.
Inputs:
MA Type: Choose between "EMA" or "SMA."
Short/Long MA Length: Customize lengths to control sensitivity.
Source: Apply to typical price values like hl2.
Risk Settings:
Minimum, maximum, and fixed profit percentages.
Stop-loss settings and risk dividers.
Trade Behavior Settings:
Max trade length.
Visualization Toggles:
Show/hide debug labels, lines, clouds.
Use Case:
This indicator is ideal for trend-following traders who prefer a semi-automated trading framework. It helps maintain consistency in entries and exits while visualizing important trend dynamics and trade health directly on the chart.
Best suited for swing trading crypto coins.
在脚本中搜索"take profit"

AI Trend Momentum SniperThe AI Trend Momentum Sniper is a powerful technical analysis tool designed for day trading. This strategy combines multiple momentum and trend indicators to identify high-probability entry and exit points. The indicator utilizes a combination of Supertrend, MACD, RSI, ATR (Average True Range), and On-Balance Volume (OBV) to generate real-time signals for buy and sell opportunities.
Key Features:
Supertrend for detecting market direction (bullish or bearish).
MACD for momentum confirmation, highlighting changes in market momentum.
RSI to filter out overbought/oversold conditions and ensure high-quality trades.
ATR as a volatility filter to adjust for changing market conditions.
OBV (On-Balance Volume) to confirm volume strength and trend validity.
Dynamic Stop-Loss & Take-Profit based on ATR to manage risk and lock profits.
This indicator is tailored for intraday traders looking for quick market moves, especially in volatile and high liquidity assets like Bitcoin (BTC) and Ethereum (ETH). It helps traders capture short-term trends with efficient risk management tools.
How to Apply:
Set Your Chart: Apply the AI Trend Momentum Sniper to a 5-minute (M5) or 15-minute (M15) chart for optimal performance.
Buy Signal: When the indicator generates a green arrow below the bar, it indicates a buy signal based on positive trend and momentum alignment.
Sell Signal: A red arrow above the bar signals a sell condition when the trend and momentum shift bearish.
Stop-Loss and Take-Profit: The indicator automatically calculates dynamic stop-loss and take-profit levels based on the ATR value for each trade, ensuring proper risk management.
Alerts: Set up custom alerts for buy or sell signals, and get notified instantly when opportunities arise.
Best Markets for Use:
BTC/USDT, ETH/USDT – High liquidity and volatility.
Major altcoins with sufficient volume.
Avoid using it on low-liquidity assets where price action may become erratic.
Timeframes:
This indicator is best suited for lower timeframes (5-minute to 15-minute charts) to capture quick price movements in trending markets.

Original Gann Swing Chart Rules [AlgoFuego]🔵 Original Gann Swing Chart Rules
An advanced indicator built on W.D. Gann’s original rules, enhanced with innovative mechanical trend-following methods.
🔹 Description
This indicator functions by balancing short-term adaptability with long-term trend analysis.
The indicator incorporates Gann’s principles alongside mechanical trend-following techniques to offer a structured method for analyzing trends and detecting potential market reversals.
Golden Rule: Non-trend bars are excluded from analysis, and each new bar is compared with the previous trend bar, it highlights significant swing points with greater clarity.
🔸 The core concept behind the golden rule on which this indicator is built.
The person watching the tide coming, wanting to pinpoint the exact spot that signals the high tide, places a stick in the sand at the points where the incoming waves reach until the stick reaches a position where the waves no longer rise, and eventually recedes enough to show that the tide has shifted.
This method is effective for monitoring and identifying tides and floods in the stock market.
🔸Rule 1: The trend bar is everything.
→It is a bar that forms a new high, low, or both.
🔸Rule 2: The professional traders track new highs and lows.
🔸Rule 3: The hidden bar is nothing.
→It is a bar that does not form a new high, low, or both.
🔸Rule 4: The sea has a wavy nature, and the market as well.
🔸Rule 5: The slope is the immediate direction of the swing.
Downward slope
→The downslope is the descending slope of a swing, shows a decline, reflecting a bearish price trend.
Upward slope
→The upslope is the ascending slope of a swing, shows an incline, reflecting a bullish price trend.
🔸Rule 6: The start and end of the movement are the swing points.
→The lowest or highest price of the last bar in the direction of the slope represents the swing point after the slopes direction changes.
Valley
→It is the lowest price of the last bar in a downslope before the market turns to a upslope.
End=> Downward slope and Start=> Upward slope
Peak
→It is the highest price of the last bar in a upslope before the market turns to an downslope.
End=> Upward slope and Start=> Downward slope
🔸Rule 7: The Golden Rule: Ignore all no-trend bars and compare the new bar with the previous trend bar.
→Applying the golden rule in upward slope
→Applying the golden rule in downward slope
🔸 Related content: Personal words of W.D Gann from the book Wall Street Stock Selector.
→"This was only one month's reaction the same as March 1925. The market held in a dull narrow range for about 2 months while accumulation was taking place and in June the main trend turned up again."
→The beginning of the main trend and the formation of the Valley.
→The beginning of the main trend and the formation of the Peak.
🔸 Rule 8: The Closing Price of the Bar to Understand Movement Direction.
Sequence is important
→ Downward bar
→ Upward bar
🔸 Outside Bar Rules
→Explanation of rules and calculations.
🔸 How does a trend start?
Upward trend
Trend change from Downward to Upward.
Prices must take out the nearest 'Peak' and the Trend was previously Downward.
A breakout above the previous peak signals a bullish reversal.
→ Model 1 - Dropping Valley Reversal
The market forms a dropping valley, followed by a breakout above the previous peak.
→ Model 2 - Equal Valley Reversal
The market forms an equal valley, followed by a breakout above the previous peak.
→ Model 3 - Rising Valley Reversal
The market forms a rising valley, followed by a breakout above the previous peak.
Downward trend
Trend change from Upward to Downward.
Prices must take out the nearest ‘Valley' and the Trend was previously Upward.
A breakdown below the previous valley signals a bearish reversal.
→ Model 1 - Rising Peak Reversal
The market forms a rising peak, followed by a breakdown below the previous valley.
→ Model 2 - Equal Peak Reversal
The market forms an equal peak, followed by a breakdown below the previous valley.
→ Model 3 - Dropping Peak Reversal
The market forms a dropping peak, followed by a breakdown below the previous valley.
🔸 The fractal nature of markets
Rising wave
→ The rising wave is the entire bull market between turning points
High point : When the Main trend turns from upward to downward, the peak of the primary trend is formed.
Dropping wave
→ The Dropping wave is the entire bear market between turning points.
Low point : When the Main trend turns from downward to upward, the primary trend valley is formed.
Fractal nature application.
Everything in one picture.
🔹 Features
Strict adherence to the rules: Follows the Original Gann Swing Chart Rules to detect swing points.
Fractal analysis: Uses trend bars and fractal analysis to identify swing points.
Robust functionality: Engineered to handle complex market conditions with advanced logic.
Custom alerts: Alerts for peak/valley completion, main and primary trend reversals & continuations.
Golden rule application: Filters out non-trend bars by comparing only with the last trend bar.
Reversal & trend detection: Applies eight outside bar rules to detect trend reversals and continuations.
Dynamic customization: Fully customizable settings.
🔹 Settings overview
Fine-tune the indicator to match your unique trading strategy by adjusting trend settings, customizing alerts, and modifying visualization options.
1. Main trend settings
Hide/Show Main trend options: Instantly hide all main trend options (alerts remain separate).
Main trendline display & alerts: Toggle trendline visibility and set alerts for peaks and valleys.
Trendline customization: Adjust styles, colors, and slopes for upward/downward trends.
Peaks & Valleys markers: Show/hide points and customize their color and size.
Opposite Main trend turning points: Enable alerts and modify style, width, color, and offset.
Breakout/Breakdown points: Set alerts and customize their appearance.
2. Primary trend settings
Hide/Show primary trend options: Instantly hide all primary trend options (alerts remain separate).
Primary trendline display & alerts: Toggle trendline visibility and set alerts for peaks and valleys.
Trendline customization: Adjust styles, colors, and slopes for upward/downward trends.
Peaks & Valleys markers: Show/hide points and customize their color and size.
Opposite primary trend turning points: Enable alerts and modify style, width, color, and offset.
Breakout/Breakdown points: Set alerts and customize their appearance.
3. Additional options
Tooltips display: Control tooltip visibility for labels and languages.
Candle/Bar coloring: Customize candle and bar colors based on algorithm-selected trends.
🔸 Additional features
🔹Custom reading of bars.
The arrow represents the direction of the slope, the dot is the type of trend, and the line is the closing price.
🔹 Advanced Moving Average Activator
The Advanced Moving Average Activator, this setting calculates the average closing prices of trend bars only, which are the only bars considered by Gann.
The advantage of this method is that it helps avoid hidden bars that are not accounted for, making the difference more evident in a ranging market. The values are updated only when new highs or lows occur.
Additionally, you can set alerts when the price closes above or below the moving average.
🔹 Bar Counter
After a trend change, you can see exactly when the shift occurred and customize the type of trend you want to track.
For example, by conducting your own research on the assets you trade, based on historical data, you might discover valuable insights, such as the primary trend possibly lasting longer than 20 bars!
You can use these insights to refine your trading strategy and make more data-driven decisions.
🔹 How to use
Step 1: Configure the settings and choose your trading approach
Adjust the indicator settings to match your trading style and market conditions.
Effectively using the indicator starts with selecting your preferred trading style.
You can trade in alignment with the primary trend, capitalize on market reversals, or take advantage of breakouts.
Trading with the primary trend: Best for traders who prefer longer-term positions with higher stability.
Trading reversals: Ideal for those looking to enter at potential turning points but requires additional confirmation.
Trading breakouts: Suitable for traders targeting strong price movements after key level breakouts.
Adapting to market volatility: Monitor changing volatility and adjust your strategy accordingly for optimal results.
Step 2: Analyze the chart
Apply the indicator to your TradingView chart and interpret swing signals for informed decisions.
Carefully study the chart patterns to detect subtle signals.
Check if similar signals worked well in past market conditions.
Use multi-timeframe analysis for a broader perspective.
Step 3: Trade with the primary trend
Utilize trend direction to align trades with prevailing market movements.
Always trade in the direction of the primary trend.
Confirm the trend direction using multiple indicators or by relying on the primary trend as confirmation!.
Avoid trading against strong market momentum.
Step 4: Identify entry signals
Use indicator signals to identify ideal trade entry points.
Look for confirmation before entering a trade.
Wait for clear signals to avoid false entries.
Practice on a demo account to build confidence in your entry strategy.
Step 5: Apply risk management
Define stop-loss and take-profit levels to protect your capital effectively.
Set stop-loss orders at strategic levels to limit potential losses.
Risk only a small percentage of your capital per trade.
Adjust risk levels based on your overall portfolio performance.
Step 6: Confirm with trend analysis
Validate trends using additional indicators for a higher probability of success.
Use complementary tools to confirm trend direction.
Monitor trend changes to adjust your strategy promptly.
Keep an eye on volume indicators for added confirmation.
Step 7: Execute the trade
Enter trades based on confirmed signals and predefined strategy rules.
Ensure all your criteria are met before executing a trade.
Stay disciplined and stick to your strategy.
Review market conditions right before execution.
Step 8: Monitor the trade
Track trade performance and make adjustments as necessary.
Keep an eye on market conditions throughout the trade.
Be ready to adjust your strategy if unexpected events occur.
Use trailing stops to secure profits while allowing for gains.
Step 9: Implement exit strategy
Close trades strategically based on your pre-established exit plan.
Plan your exit strategy in advance and adhere to it.
Consider partial exits to secure profits along the way.
Avoid emotional decisions when closing trades.
Step 10: Review performance
Analyze past trades to continuously refine and improve your strategy.
Regularly review and document your trades for insights.
Identify patterns in both your successes and mistakes.
Update your strategy based on comprehensive performance reviews.
🔹 Disclosure
While this script is useful and provides insight into market tops, bottoms, and trend trading, it's critical to understand that past performance is not necessarily indicative of future results and there are many more factors that go into being a profitable trader.

PROFIT ZONE PRO Profit Zone Pro:
ProfitZone Pro is a risk-reward indicator that helps traders identify trade setups, manage risk, and set profit targets. Designed for simplicity, this free tool generates entry, stop-loss, and take-profit levels based on support and resistance, Trailing Stoploss and built in automated alerts, with additional features to enhance trade planning, Along with a learning mode based on successful trades made
Features
Trade Setup Identification: Detects potential buy (long) or sell (short) entries using support and resistance levels, with an optional trend filter based on a 50-period SMA.
Risk-Reward Zones: Displays entry (yellow), stop-loss (red), and take-profit (green) levels, with shaded risk (red) and reward (green) zones.
Position Sizing: Calculates position size based on user-defined risk percentage and account balance.
Breakeven and Trailing Stop: Includes a breakeven feature to move the stop-loss to the entry price at a user-defined percentage of the take-profit distance, and an optional trailing stop to lock in profits.
Confidence Score: Provides a volatility-based confidence score (0-100%) to assess setup reliability.
Learning Adjustment: Adjusts stop-loss distances based on the number of successful trades entered by the user.
Info Label: Shows position size, risk, reward, direction, confidence score, ATR, trend direction (if enabled), and trailing stop status.
Alerts: Sends notifications for entry, stop-loss, take-profit, breakeven, trailing stop, and theme changes.
Customizable Display: Offers options for zone opacity, line styles (solid, circles, dotted), zone labels, and color themes (Light, Dark, Custom).
Long Mode Feature:
Short Mode Feature:
Trend Filter Feature:
Auto Trading Mode:
Usage Instructions
Add the indicator to your chart.
Adjust settings in the indicator’s properties:
Set Risk % of Account and Account Balance to define your risk and position size.
Choose Trade Direction (Auto, Long, or Short) to filter setups.
Enable Trend Filter to align trades with the market trend.
Turn on Trailing Stop and set Trailing Stop % of Reward to lock in profits.
Customize visuals (zone opacity, line style, colors) as needed.
Monitor the chart for entry (yellow), stop-loss (red), and take-profit (green) levels.
Use the info label to view position size, risk, reward, confidence score, and other details.
Set alerts for entry, stop-loss, take-profit, breakeven, and trailing stop events.
After a successful trade, increment Number of Successful Trades to adjust future stop-loss distances.
This Script is to help you have a better idea on those famous questions we ask ourselves:
Entry
Take Profit
Stoploss
The confidence score, R:R calculator, Trend Filter, Learning Mode further helps to zone in on accuracy
Happy Trading
- EZ ALGO

Pivot Point Calculator PPC V2 by [KhedrFx]📈 Trade Smarter with the Pivot Point Calculator (PPC) by KhedrFx
Want to spot key price levels and make better trading decisions? The Pivot Point Calculator (PPC) by KhedrFx is your go-to TradingView tool for identifying potential support and resistance zones. Whether you’re a Scalper trader, day trader, swing trader, or long-term investor, this script helps you plan precise entries and exits with confidence.
🔹 How to Use Pivot Points in Trading
📊 Step 1: Identify Key Levels
The PPC automatically plots:
Pivot Point (P): The main level where sentiment shifts between bullish and bearish.
Support Levels (S1, S2, S3): Areas where price may bounce higher.
Resistance Levels (R1, R2, R3): Areas where price may face selling pressure.
These levels act as dynamic price zones, helping you anticipate potential market movements.
🔥 Step 2: Choose Your Trading Strategy
1️⃣ Breakout Trading
Buy when the price breaks above the pivot point (P) with strong momentum.
Sell when the price drops below the pivot point (P) with strong momentum.
Use R1, R2, or R3 as profit targets in an uptrend and S1, S2, or S3 in a downtrend.
2️⃣ Reversal (Bounce) Trading
Buy when the price pulls back to S1, S2, or S3 and shows bullish confirmation (e.g., candlestick patterns like a bullish engulfing or hammer).
Sell when the price rallies to R1, R2, or R3 and shows bearish confirmation (e.g., rejection wicks or a bearish engulfing pattern).
🎯 Step 3: Set Smart Stop-Loss & Take-Profit Levels
Stop-Loss: Place it slightly below support (for buy trades) or above resistance (for sell trades).
Take-Profit: Use the next pivot level as a target.
Extreme Zones: R3 and S3 often signal strong reversals or breakouts—watch them closely!
🚀 How to Get Started
1️⃣ Add the PPC script to your TradingView chart.
2️⃣ Choose a timeframe that fits your strategy (5m, 15m, 30m, 1H, 4H, Daily, or Weekly).
3️⃣ Use the pivot points and support/resistance levels to fine-tune your trade entries, exits, and risk management.
⚠️ Trade Responsibly
This tool helps you analyze the market, but it’s not a guarantee of profits. Always do your own research, manage risk, and trade with caution.
💡 Ready to take your trading to the next level? Try the Pivot Point Calculator (PPC) by KhedrFx and start trading with confidence today! 🚀

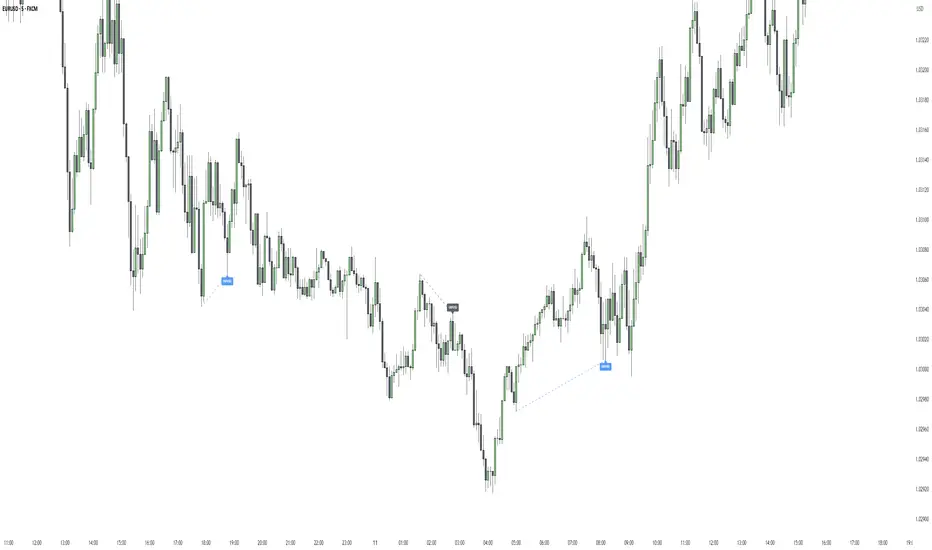
[TehThomas] - ICT SMT DivergencesIntroduction
SMT Divergences is a cutting-edge trading tool designed for traders who utilize Smart Money Techniques (SMT), a core concept in the Inner Circle Trader (ICT) methodology. This indicator is specifically built to detect SMT divergences by comparing price action across multiple correlated assets. It helps traders identify institutional activity, liquidity grabs, and inefficiencies in the market, offering valuable insights for high-probability trade setups.
Smart Money Techniques revolve around the idea that institutional traders and large market participants leave behind footprints in the form of price divergences. By analyzing multiple asset pairs simultaneously, this indicator helps traders pinpoint areas where one market structure contradicts another, revealing potential trade opportunities before the majority of retail traders notice them.
What is SMT Divergence?
Smart Money Divergence (SMT) occurs when correlated assets or markets behave differently in key areas of interest. These divergences often indicate market inefficiencies caused by liquidity grabs or institutional order flow. There are two main types of SMT divergences:
1. Bearish SMT Divergence (Smart Money Distribution) 🔴
Occurs when:
One asset makes a higher high, while another correlated asset makes a lower high.
This signals underlying weakness in the price action of the first asset.
Institutions may be offloading positions, preparing for a downward move.
📉 Example: If GBP/USD makes a higher high, but EUR/USD makes a lower high, it indicates potential weakness in GBP/USD and a possible short opportunity.
2. Bullish SMT Divergence (Smart Money Accumulation) 🔵
Occurs when:
One asset makes a lower low, while another correlated asset makes a higher low.
This suggests strength and potential accumulation by institutional traders.
Smart Money may be positioning for a bullish reversal.
📈 Example: If NASDAQ (US100) makes a lower low, but S&P 500 (US500) makes a higher low, it could indicate bullish strength in the stock market, suggesting a possible long trade.
How This Indicator Works
The SMT Divergences automatically identifies and plots SMT divergences on your chart, allowing you to spot hidden market imbalances at a glance.
🔍 Key Features
✅ Compare Up to 4 Assets Simultaneously – Select up to four correlated pairs to compare against the main charted asset.
✅ Automatic Detection of SMT Divergences – The script finds divergences in swing highs and swing lows and visually marks them on the chart.
✅ Customizable Line Styles & Colors – Adjust the appearance of the divergence lines and labels to suit your trading style.
✅ Smart Labeling System – Displays which asset pairs are diverging, making it easy to analyze market conditions.
✅ Works Across Multiple Markets – Use for Forex, Indices, Crypto, and Commodities, giving traders flexibility in different asset classes.
✅ Designed for ICT Traders – Aligns perfectly with other ICT concepts such as Liquidity Zones, Order Blocks, and Fair Value Gaps (FVGs).
🛠 Indicator Settings & Customization
The indicator provides various settings to tailor it to your trading preferences:
Pivot Lookback Length: Adjusts how many bars the indicator looks back to determine swing highs/lows.
Symbol Selection: Choose up to four additional assets to compare against your main trading pair.
Divergence Line Colors: Customize the color of bearish (red) and bullish (blue) divergences for better visibility.
Line Styles: Choose between solid, dotted, or dashed lines to highlight divergences in your preferred way.
Label Customization: Modify text color and display preferences for a clean and informative chart layout.
How to Use This Indicator in Your Trading Strategy
This indicator is best used in combination with other ICT concepts to improve confluence and increase trade accuracy. Here’s how you can integrate it into your trading strategy:
🔹 Step 1: Identify SMT Divergences
Wait for bullish or bearish SMT divergences to appear on your chart.
Check if the divergence aligns with key liquidity zones, fair value gaps (FVGs), or order blocks.
🔹 Step 2: Confirm Institutional Activity
Look for liquidity sweeps (stop hunts) before a potential reversal.
If a bearish SMT divergence forms near a major resistance level, it may signal Smart Money selling.
If a bullish SMT divergence forms near a support zone, it could indicate accumulation.
🔹 Step 3: Enter a Trade with Confluence
Combine SMT divergences with market structure shifts to time entries.
Use additional ICT tools like Premium & Discount Arrays, Volume Profile, and Market Maker Models for confirmation.
Set stop-losses above liquidity zones and aim for high-risk reward ratios.
🔹 Step 4: Manage Risk & Take Profits
Always use proper risk management, keeping an eye on liquidity grabs and market sentiment.
Consider taking partial profits at key structural points and letting the rest of the trade run.
Why This Indicator is a Game-Changer for ICT Traders
Traditional retail traders often fail to spot Smart Money footprints, which is why many struggle with false breakouts and liquidity traps. The - ICT SMT Divergences indicator eliminates this problem by providing a clear, visual representation of SMT divergences, allowing traders to track institutional movements in real-time.
🔹 Save Time – No need to manually compare charts; the script does the work for you.
🔹 Improve Accuracy – Get high-probability trade setups by following institutional footprints.
🔹 Enhance Your Trading Edge – Use SMT divergences in combination with liquidity grabs, order blocks, and fair value gaps to refine your strategy.
🔹 Universal Market Compatibility – Works for Forex, Indices, Crypto, Commodities, and even Stocks, giving you flexibility in different markets.
Final Thoughts
The SMT Divergences is a must-have tool for traders who rely on Smart Money Techniques (SMT) and ICT methodologies. By identifying SMT divergences across multiple correlated markets, this indicator provides unparalleled insights into institutional trading behavior and enhances your ability to trade with Smart Money.
Whether you are a day trader, swing trader, or position trader, this indicator will help you make more informed decisions, avoid liquidity traps, and improve your overall profitability.
__________________________________________
Thanks for your support!
If you found this idea helpful or learned something new, drop a like 👍 and leave a comment, I’d love to hear your thoughts! 🚀
Make sure to follow me for more price action insights, free indicators, and trading strategies. Let’s grow and trade smarter together! 📈
Democratic MultiAsset Strategy [BerlinCode42]Happy Trade,
Intro
Included Trade Concept
Included Indicators and Compare-Functions
Usage and Example
Settings Menu
Declaration for Tradingview House Rules on Script Publishing
Disclaimer
Conclusion
1. Intro
This is the first multi-asset strategy available on TradingView—a market breadth multi-asset trading strategy with integrated webhooks, backtesting capabilities, and essential strategy components like Take Profit, Stop Loss, Trailing, Hedging, Time & Session Filters, and Alerts.
How It Trades? At the start of each new bar, one asset from a set of eight is selected to go long or short. As long there is available cash and the selected asset meets the minimum criteria.
The selection process works through a voting system, similar to a democracy. Each asset is evaluated using up to five indicators that the user can choose. The asset with the highest overall voting score is picked for the trade. If no asset meets all criteria, no trade is executed, and the cash reserve remains untouched for future opportunities.
How to Set Up This Market Breadth Strategy:
Choose eight assets from the same market (e.g., cryptos or big tech stocks).
Select one to five indicators for the voting system.
Refine the strategy by adjusting Take Profit, Stop Loss, Hedging, Trailing, and Filters.
2. Voting as the included Trade Concept
The world of financial trading is filled with both risks and opportunities, and the key challenge is to identify the right opportunities, manage risks, and do both right on time.
There are countless indicators designed to spot opportunities and filter out risks, but no indicator is perfect—they only work statistically, hitting the right signals more often than the wrong ones.
The goal of this strategy is to increase the accuracy of these Indicators by:
Supervising a larger number of assets
Filtering out less promising opportunities
This is achieved through a voting system that compares indicator values across eight different assets. It doesn't just compare long trades—it also evaluates long vs. short positions to identify the most promising trade.
Why focus on one asset class? While you can randomly select assets from different asset classes, doing so prevents the algorithm from identifying the strongest asset within a single class. Think about, within one asset class there is often a major trend whereby different asset classes has not really such behavior.
And, you don’t necessarily need trading in multiple classes—this algorithm is designed to generate profits in both bullish and bearish markets. So when ever an asset class rise or fall the voting system ensure to jump on the strongest asset. So this focusing on one asset class is an integral part of this strategy. This all leads to more stable and robust trading results compared to handling each asset separately.
3. Included Indicators and Compare-Functions
You can choose from 17 different indicators, each offering different types of signals:
Some provide a directional signal
Some offer a simple on/off signal
Some provide both
Available Indicators: RSI, Stochastic RSI, MFI, Price, Volume, Volume Oscillator, Pressure, Bilson Gann Trend, Confluence, TDI, SMA, EMA, WMA, HMA, VWAP, ZLMA, T3MA
However, these indicators alone do not generate trade signals. To do so, they must be compared with thresholds or other indicators using specific comparison functions.
Example – RSI as a Trade Signal. The RSI provides a value between 0 and 100. A common interpretation is:
RSI over 80 → Signal to go short or exit a long trade
RSI under 20 → Signal to go long or exit a short trade
Here, two comparison functions and two thresholds are used to determine trade signals.
Below is the full set of available comparison functions, where: I represents the indicator’s value and A represents the comparator’s value.
I < A if I smaller A then trade signal
I > A if I bigger A then trade signal
I = A if I equal to A then trade signal
I != A if I not equal to A then trade signal
A <> B if I bigger A and I smaller B then trade signal
A >< B if I smaller A then long trade signal or if I bigger B then short trade signal
Image 1
In Image 1, you can see one of five input sections, where you define an indicator along with its function, comparator, and constants. For our RSI example, we select:
Indicator: RSI
Function: >< (greater/less than)
Comparator: Constant
Constants: A = 20, B = 80
With these settings a go short signal is triggered when RSI crosses above 80. And a go long signal is triggered when RSI crosses below 20.
Relative Strength Indicator: The RSI from the public TradingView library provides a directional trade signal. You can adjust the price source and period length in the indicator settings.
Stochastic Relative Strength Indicator: As above the Stoch RSI offers a trade signal with direction. It is calculated out of the RSI, the stochastic derivation and the SMA from the Tradingview library. You can set the in-going price source and the period length for the RSI, for the Stochastic Derivation and for the SMA as blurring in the Indicator settings section.
Money Flow Indicator: As above the MFI from the public Tradingview library offers a trade signal with direction. You can set the in-going price source and the period length in the Indicator settings section.
Price: The Price as Indicator is as simple as it can be. You can chose Open, High, Low or Close or combinations of them like HLC3 or even you can import an external Indicator. The absolute price or value can later be used to generate a trade signals when certain constant thresholds or other indicators signals are crossed.
Volume: Similar as above the Volume as Indicator offers the average volume as absolute value. You can set the period length for the smoothing and you can chose where it is presented in the base currency $ or is the other. For example the trade pair BTCUSD you can chose to present the value in $ or in BTC.
Volume Oscillator: The Volume Oscillator Indicator offers a value in the range of . Whereby a value close to 0 means that the volume is very low. A value around 1 means the volume is same high as before and Values higher as 1 means the volume is bigger then before. You can set the period length for the smoothing and you can chose where it is presented in the base currency $ or is the other. For example the trade pair BTCUSD you can chose to present the value in $ or in BTC.
Pressure Indicator: The Pressure is an adapted version of LazyBear's script (Squeeze Momentum Indicator) Pressure is a Filter that highlight bars before a bigger price move in any direction. The result are integer numbers between 0 and 4 whereby 0 means no bigger price move excepted, while 4 means huge price move expected. You can set the in-going price source and the period length in the Indicator settings section.
Bilson Gann Trend: The Bilson Gann Trend Indicator is a specific re-implementation of the widely known Bilson Gann Count Algorithm to detect Highs and Lows. On base of the last four Highs and Lows a trend direction can be calculated. It is based on 2 rules to confirm a local pivot candidate. When a local pivot candidate is confirmed, let it be a High then it looks for Lows to confirm. The result range is whereby -1 means down trend, 1 means uptrend and 0 sideways.
Confluence: The Confluence Indicator is a simplified version of Dale Legan's "Confluence" indicator written by Gary Fritz. It uses five SMAs with different periods lengths. Whereby the faster SMA get compared with the (slower) SMA with the next higher period lengths. Is the faster SMA smaller then the slower SMA then -1, otherwise +1. This is done with all SMAs and the final sum range between . Whereby values around 0 means price is going side way, Crossing under 0 means trend change from bull to bear. Is the value>2 means a strong bull trend and <-2 a strong bear trend.
Trades Dynamic Index: The TDI is an adapted version from the "Traders Dynamic Index" of LazyBear. The range of the result is whereby 2 means Top goShort, -2 means Bottom goLong, 0 is neutral, 1 is up trend, -1 is down trend.
Simple Moving Average: The SMA is the one from the Tradingview library. You can compare it with the last close price or any other moving average indicator to indicate up and down trends. You can set the in-going price source and the period length in the Indicator settings section.
Exponential Moving Average: The EMA as above is the one from the Tradingview library. You can compare it with the last close price or any other moving average indicator to indicate up and down trends. You can set the in-going price source and the period length in the Indicator settings section.
Weighted Moving Average: The WMA as above is the one from the Tradingview library. You can compare it with the last close price or any other moving average indicator to indicate up and down trends. You can set the in-going price source and the period length in the Indicator settings section.
Hull Moving Average: HMA as above is the one from the Tradingview library. You can compare it with the last close price or any other moving average indicator to indicate up and down trends. You can set the in-going price source and the period length in the Indicator settings section.
Volume Weighted Average Price: The VWAP as above is the one from the Tradingview library. You can compare it with the last close price or any other moving average indicator to indicate up and down trends. You can set the in-going price source in the Indicator settings section.
Zero Lag Moving Average: The ZLMA by John Ehlers and Ric Way describe in their paper: www.mesasoftware.com
As the other moving averages you can compare it with the last close price or any other moving average indicator to indicate up and down trends. You can set the in-going price source and the period length in the Indicator settings section.
T3 Moving Average: The T3MA is the one from the Tradingview library. You can compare it with the last close price or any other moving average indicator to indicate up and down trends. You can set the in-going price source, the period length and a factor in the Indicator settings section. Keep this factor at 1 and the T3MA swing in the same range as the input. Bigger 1 and it swings over. Factors close to 0 and the T3MA becomes a center line.
All MA's following the price. The function to compare any MA Indicators would be < or > to generate a trade direction. An example follows in the next section.
4. Example and Usage
In this section, you see how to set up the strategy using a simple example. This example was intentionally chosen at random and has not undergone any iterations to refine the trade results.
We use the RSI as the trade signal indicator and apply a filter using a combination of two moving averages (MAs). The faster MA is an EMA, while the slower MA is an SMA. By comparing these two MAs, we determine a trend direction. If the faster MA is above the slower MA the trend is upwards etc. This trend direction can then be used for filtering trades.
The strategy follows these rules:
If the RSI is below 20, a buy signal is generated.
If the RSI is above 80, a sell signal is generated.
However, this RSI trade signal is filtered so that a trade is only given the maximum voting weight if the RSI trade direction aligns with the trend direction determined by the MA filter.
So first, you need to add your chosen assets or simply keep the default ones. In Image 2, you can see one of the eight asset input sections.
Image 2
This strategy offers some general trade settings that apply equally to all assets and some asset-specific settings. This distinction is necessary because some assets have higher volatility than others, requiring asset-specific Take Profit and Stop Loss levels.
Once you have made your selections, proceed to the Indicators and Compare Functions for the voting. Image 3 shows an example of this setup.
Image 3
Later on go to the Indicator specific settings shown in Image 4 to refine the trade results.
Image 4
For refine the trade results take also a look on the result summary table, development of capital plot, on the list of closed and open trades and screener table shown in Image 5.
Image 5
To locate any trade for any asset in the chronological and scroll-able trade list, each trade is marked with a label:
An opening label displaying the trade direction, ticker ID, trade number, invested amount, and remaining cash reserves.
A closing label showing the closing reason, ticker ID, trade number, trade profit (%), trade revenue ($), and updated cash reserves.
Additionally: a green line marks each Take Profit level. An orange line indicates the (trailing) Stop Loss.
The summary table in the bottom-left corner provides insights into how effective the trade strategy is. By analyzing the trade list, you can identify trades that should be avoided.
To find those bad trades on the chart, use the trade number or timestamp. With replay mode, you can go back in time to review a specific trade in detail.
Image 6
In Image 6, you can see an example where replay mode and the start time filter are used to display specific trades within a narrow time range. By identifying a large number of bad trades, you may recognize patterns and formulate conditions to avoid them in the future.
This is the backtesting tool that allows you to develop and refine your trading strategy continuously. With each iteration—from general adjustments to detailed optimizations—you can use these tools to improve your strategy. You can:
Add other indicators with trade signals and direction
Add more indicators signals as filter
Adjust the settings of your indicators to optimize results
Configure key strategy settings, such as Time and Session Filters, Stop Loss, Take Profit, and more
By doing so, you can identify a profitable strategy and its optimal settings.
5. Settings Menu
In the settings menu you will find the following high-lighted sections. Most of the settings have a i mark on their right side. Move over it with the cursor to read specific explanation.
Backtest Results: Here you can decide about visibility of the trade list, of the Screener Table and of the Results Summary. And the colors for bullish, side ways, bearish and no signal. Go above and see Image 5.
Time Filter: You can set a Start time or deactivate it by leave it unhooked. The same with End Time and Duration Days . Duration Days can also count from End time in case you deactivate Start time.
Session Filter: Here, you can chose to activate trading on a weekly basis, specifying which days of the week trading is allowed and which are excluded. Additionally, you can configure trading on a daily basis, setting the start and end times for when trades are permitted. If activated, no new trades will be initiated outside the defined times and sessions.
Trade Logic: Here you can set an extra time frame for all indicators. You can enable Longs or Shorts or both trades.
The min Criteria percentage setting defines the minimum number of voices an asset has to get to be traded. So if you set this to 50% or less also weak winners of the voting get traded while 100% means that the winner of the voting has to get all possible voices.
Additionally, you have the option to delay entry signals. This feature is particularly useful when trade signals exhibit noise and require smoothing.
Enable Trailing Stop and force the strategy to trade only at bar closing. Other-ways the strategy trade intrabar, so when ever a voting present an asset to trade, it will send the alert and the webhooks.
The Hedging is basic as shown in the following Image 7 and serves as a catch if price moves fast in the wrong direction. You can activate a hedging mechanism, which opens a trade in the opposite direction if the price moves x% against the entry price. If both the Stop Loss and Hedging are triggered within the same bar, the hedging action will always take precedence.
Image 6
Indicators to use for Trade Signal Generating: Here you chose the Indicators and their Compare Function for the Voting . Any activated asset will get their indicator valuation which get compared over all assets. The asset with the highest valuation is elected for the trade as long free cash is present and as long the minimum criteria are met.
The Screener Table will show all indicators results of the last bar of all assets. Those indicator values which met the threshold get a background color to high light it. Green for bullish, red for bearish and orange for trade signals without direction. If you chose an Indicator here but without any compare function it will show also their results but with just gray background.
Indicator Settings: here you can setup the indicator specific settings. for deeper insights see 3. Included Indicators and Compare-Functions .
Assets, TP & SL Settings: Asset specific settings. Chose here the TickerID of all Assets you wanna trade. Take Profit 1&2 set the target prices of any trade in relation to the entry price. The Take Profit 1 exit a part of the position defined by the quantity value. Stop Loss set the price to step out when a trade goes the wrong direction.
Invest Settings: Here, you can set the initial amount of cash to start with. The Quantity Percentage determines how much of the available cash is allocated to each trade, while the Fee percentage specifies the trading fee applied to both opening and closing positions.
Webhooks: Here, you configure the License ID and the Comment . This is particularly useful if you plan to use multiple instances of the script, ensuring the webhooks target the correct positions. The Take Profit and Stop Loss values are displayed as prices.
6. Declaration for Tradingview House Rules on Script Publishing
The unique feature of this Democratic Multi-Asset Strategy is its ability to trade multiple assets simultaneously. Equipped with a set of different standard Indicators, it's new democratic Voting System does more robust trading decisions compared to single-asset. Interchangeable Indicators and customizable strategy settings allowing for a wide range of trading strategies.
This script is closed-source and invite-only to support and compensate for over a year of development work. Unlike other single asset strategies, this one cannot use TradingView's strategy functions. Instead, it is designed as an indicator.
7. Disclaimer
Trading is risky, and traders do lose money, eventually all. This script is for informational and educational purposes only. All content should be considered hypothetical, selected post-factum and is not to be construed as financial advice. Decisions to buy, sell, hold, or trade in securities, commodities, and other investments involve risk and are best made based on the advice of qualified financial professionals. Past performance does not guarantee future results. Using this script on your own risk. This script may have bugs and I declare don't be responsible for any losses.
8. Conclusion
Now it’s your turn! Chose an asset class and pick 8 of them and chose some indicators to see the trading results of this democratic voting system. Refine your multi-asset strategy to favorable settings. Once you find a promising configuration, you can set up alerts to send webhooks directly. Configure all parameters, test and validate them in paper trading, and if results align with your expectations, you even can deploy this script as your trading bit.
Cheers

Hanzo_Wave_Price %Hanzo_Wave_Price % is a custom indicator for the TradingView platform that combines RSI (Relative Strength Index) and Stochastic RSI while also displaying the percentage price change over a specified period. This indicator helps traders identify overbought and oversold conditions, analyze price waves, and forecast potential market movements.
How It Works
1. RSI and Stochastic RSI Calculation
RSI is calculated based on the selected price source (default: close) with a user-defined Main Line period.
Stochastic RSI is then applied and smoothed using a moving average.
The Main Line represents the smoothed Stochastic RSI, serving as a wave indicator to help identify potential entry and exit points.
2. Overbought and Oversold Zones
The 70 and 30 levels indicate overbought and oversold zones, displayed as dashed lines on the chart.
Additional 20% and 10% levels provide a visual reference for historical price changes, aiding in future predictions.
3. Percentage Price Change Calculation
The indicator calculates the percentage price change over a Barsback period (default: 30 candles).
Users can choose a multiplier (100 or 1000) for better visualization (1000 scales the values by dividing by 10).
The data is displayed as a colored area:
Red (Short) → Negative price change.
Green (Buy) → Positive price change.
Settings & Parameters
Multiplier 💪 – Selects the scaling factor (100 or 1000) for percentage values.
Main Line ✈️ – Stochastic smoothing period (smoothK).
Don't touch ✋ – Reserved value (do not modify).
RSI 🔴 – RSI calculation period.
Stochastic 🔵 – Stochastic RSI calculation period.
Source ⚠️ – Price source for calculations (default: close).
Price changes % 🔼🔽 – Enables percentage price change display.
Barsback ↩️ – Number of candles used to calculate price change.
Visual Representation
Gray Line (Takeprofit Line 🎯) – Smoothed Stochastic RSI.
Red Dashed Line (70) – Overbought zone.
Blue Dashed Line (30) – Oversold zone.
Percentage Price Change Display:
Green Fill → Price increase.
Red Fill → Price decrease.
Advantages
✅ Combined Analysis – Uses RSI and Stochastic RSI for more accurate market condition identification.
✅ Flexibility – Customizable parameters allow adaptation for different markets and strategies.
✅ Visual Clarity – Clearly defined zones and dynamic percentage change display.
✅ Additional Market Insights – The percentage price change helps assess market volatility.
Disadvantages
⚠ Lagging Signals – Smoothing may cause delayed response.
⚠ False Breakouts – The 70/30 levels may not always work effectively for all assets.
⚠ IMPORTANT!
This indicator is for informational and educational purposes only. Past performance does not guarantee future profits! Use it in combination with other technical analysis tools. 🚀
Example 1: Identifying a Long Position
📌 Scenario:
The asset price has dropped significantly (1-hour timeframe), and the Main Line (gray line) crosses below the 30 level. This signals oversold conditions, which may indicate a potential reversal or upward correction.
✅ How to Use:
1️⃣ Identifying the Entry Zone:
If the Main Line is below 30, consider looking for a long entry point.
2️⃣ Confirming the Signal:
Place a vertical line at the moment when the Main Line crosses the 30 level from below.
3️⃣ Confirmation on a Lower Timeframe:
Switch to a 30-minute timeframe and wait for the Main Line to cross above the 70 level.
Enter a long position at this point.
4️⃣ Analyzing Percentage Price Change:
Check the historical indicator behavior:
If a similar past movement resulted in a ~10% price increase (green fill), this may indicate potential upward momentum.
5️⃣ Setting Take-Profit:
Set a take-profit level at 10%, based on previous price movements.
Also, monitor when the Main Line crosses the 70 level, as this may signal a potential profit-taking point.
📊 Conclusion:
This method helps to precisely determine entry points by confirming signals across multiple timeframes and analyzing the historical volatility of the asset. 🚀
Example 2: Analyzing Percentage Price Change
📌 Scenario:
You have set the Barsback parameter to 30, and the indicator shows +3.5%. This means that over the last 30 candles, the price has increased by 3.5%.
However, such small changes might be visually difficult to notice. To improve visibility, you can enable the multiplier (1000), which will scale the displayed percentage change to 35%. This is purely for visual convenience—the actual price movement remains 3.5%.
✅ How to Use:
1️⃣ Identifying Trend Direction:
If the percentage change is positive (green area) → Uptrend.
If the percentage change is negative (red area) → Downtrend.
2️⃣ Analyzing Movement Strength:
Compare the current percentage change with previous waves to evaluate the strength of the movement.
For example:
If previous waves reached 10% or more, a current wave of 3.5% might indicate a weak trend or a local correction.
3️⃣ Additional Filtering with the Main Line (Gray Line):
Use the Main Line to confirm the trend.
If the percentage change shows an increase, but the Main Line is still below 30, further upward movement can be expected.
If the percentage change indicates a decline, but the Main Line is above 70, there is a higher probability of a downward reversal.
"It's unfortunate that TradingView restricts adding images to indicator descriptions unless you have a paid subscription. This makes it harder to share free tools effectively."

Pivot Candles with MFI Opacity (No Plot)How to Use the Pivot Candles with MFI Opacity Indicator for Trade Entries and Position Management
Overview
This indicator is designed not only to display key pivot levels (support and resistance) and Money Flow Index (MFI) signals on your chart, but also to help you structure systematic order entries and position management. By combining pivot levels with dynamic MFI-based candle opacity, the indicator provides a visual framework that technical analysts and quants can use to time buy and sell stop orders as well as to pyramid positions or take profits.
Trade Entry with Pivot Levels
Buy Stop Orders Above R1:
Concept: In many technical setups, resistance levels such as R1 are viewed as potential breakout points. A buy stop order placed just above R1 allows you to enter a long position only when price decisively breaks the prior resistance, confirming bullish momentum.
How It Works:
The indicator calculates pivot levels based on the previous higher‑timeframe bar, so R1 is “locked in” for the current period.
When the current candle closes above R1, it may signal a breakout.
Technical analysts often place a buy stop order slightly above R1 (for example, a few ticks or pips above the level) to confirm the move.
Practical Application:
Quants and systematic traders can program their models to monitor when the current close exceeds R1.
Once this condition is met, a buy stop order is triggered to capture the breakout move, ensuring that you only participate if the price decisively moves upward.
Sell Stop Orders Below S1:
Concept: Conversely, S1 acts as a support level. A sell stop order placed just below S1 is designed to capture a breakdown. This order is activated when price closes below S1, indicating that selling pressure may be overwhelming.
How It Works:
With pivot levels fixed from the previous higher‑timeframe bar, S1 provides a reference for potential support.
A close below S1 can be interpreted as a sign of a bearish reversal or a continuation of a downtrend.
Practical Application:
Quants set up their systems to watch for a break below S1.
A sell stop order is positioned just below S1 to ensure that if the support level fails, the system can quickly initiate a short position to capture the downward move.
Using MFI for Position Management
Pyramiding and Profit Taking:
Dynamic Candle Opacity:
The Money Flow Index (MFI) in this indicator not only provides overbought/oversold alerts but also controls the opacity of your candlesticks. When MFI readings are high, the candles become more opaque, indicating strong buying pressure. Conversely, lower MFI values lead to more transparent candles, suggesting reduced momentum.
Pyramiding Long Positions:
Strategy:
In a strong trend, technical analysts might choose to add to a winning position gradually—a process known as pyramiding.
Implementation:
As long as the price remains above R1 and MFI readings are supportive (high and consistent), you may consider adding to your long position incrementally.
Each new buy stop order can be set above R1 with slightly adjusted trigger levels to capture further breakout strength.
Risk Management:
Quants use the MFI reading as a risk filter; if MFI begins to drop or the candles become significantly more transparent, it may be a cue to stop pyramiding or even begin taking profits.
Taking Profit Using MFI and Pivot Reversals:
Profit Targeting:
When price reaches higher resistance levels (e.g., R2 or R3) or shows signs of overextension in conjunction with extreme MFI levels (for instance, a sudden drop in MFI after a strong rally), you can begin taking partial profits.
Systematic Exit:
A systematic strategy might include scaling out of the position as the price approaches the next resistance level or when the MFI indicates that buying momentum is waning.
Similarly, for short positions entered below S1, profit targets might be set near subsequent support levels, with exits triggered if MFI suggests a reversal.
Summary
Entry Orders:
Place buy stop orders just above R1 to capture breakouts.
Place sell stop orders just below S1 to capture breakdowns.
Position Management with MFI:
Use MFI-based candle opacity as a visual indicator of momentum.
Pyramid positions in the direction of the trend when MFI confirms strength.
Consider partial exits if MFI readings start to reverse or if the price nears the next pivot level.
By following this systematic approach, technical analysts and quants can use the indicator not only as a visual tool but as an integral part of an automated or semi-automated trading system that emphasizes disciplined entries, pyramiding, and profit-taking.

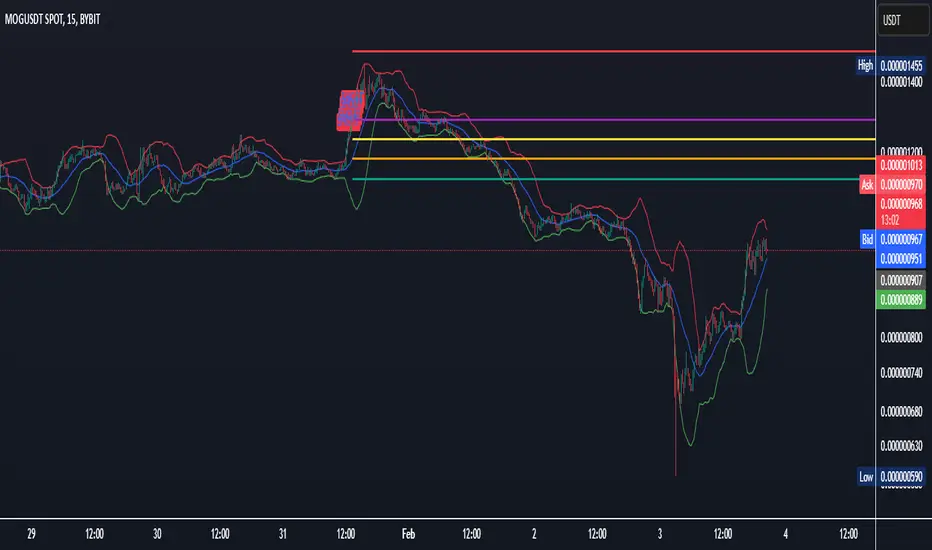
AdvancedLines (FiboBands) - PaSKaL
Overview :
AdvancedLines (FiboBands) - PaSKaL is an advanced technical analysis tool designed to automate the plotting of key Fibonacci retracement levels based on the highest high and lowest low over a customizable period. This indicator helps traders identify critical price zones such as support, resistance, and potential trend reversal or continuation points.
By using AdvancedLines (FiboBands) - PaSKaL , traders can easily spot key areas where the price is likely to reverse or consolidate, or where the trend may continue. It is particularly useful for trend-following, scalping, and range-trading strategies.
Key Features:
Automatic Fibonacci Level Calculation :
- The indicator automatically calculates and plots key Fibonacci levels (0.236, 0.382, 0.5, 0.618, and 0.764), which are crucial for identifying potential support and resistance levels in the market.
Adjustable Parameters :
- Bands Length: You can adjust the bands_length setting to change the number of bars used for calculating the highest high and lowest low. This gives flexibility for using the indicator on different timeframes and trading styles.
- Visibility: The Fibonacci levels, as well as the midline (0.5 Fibonacci level), can be shown or hidden based on your preference.
- Color Customization: You can change the color of each Fibonacci level and background fills to suit your chart preferences.
Fibonacci Levels
- The main Fibonacci levels plotted are:
- 0.236 – Minor support/resistance level
- 0.382 – Moderate retracement level
- 0.5 – Midpoint retracement, often used as a key level
- 0.618 – Golden ratio, considered one of the most important Fibonacci levels
- 0.764 – Strong reversal level, often indicating a continuation or change in trend
Background Fill
- The indicator allows you to fill the background between the Fibonacci levels and the bands with customizable colors. This makes it easier to visually highlight key zones on the chart.
How the Indicator Works:
AdvancedLines (FiboBands) - PaSKaL calculates the range (difference between the highest high and the lowest low) over a user-defined number of bars (e.g., 300). Fibonacci levels are derived from this range, helping traders identify potential price reversal points.
Mathematical Basis :
Fibonacci retracement levels are based on the Fibonacci sequence, where each number is the sum of the previous two (0, 1, 1, 2, 3, 5, 8, 13, etc.). The ratios derived from this sequence (such as 0.618 and 0.382) have been widely observed in nature, market cycles, and price movements. These ratios are used to forecast potential price retracements or continuation points after a major price move.
Fibonacci Levels Calculation :
Identify the Range: The highest high and the lowest low over the defined period are calculated.
Apply Fibonacci Ratios: Fibonacci ratios (0.236, 0.382, 0.5, 0.618, and 0.764) are applied to this range to calculate the corresponding price levels.
Plot the Levels: The indicator automatically plots these levels on your chart.
Customizing Fibonacci Levels & Colors:
The "AdvancedLines (FiboBands) - PaSKaL" indicator offers various customization options for Fibonacci levels, colors, and visibility:
Fibonacci Level Ratios:
- You can customize the Fibonacci level ratios through the following inputs:
- Fibo Level 1: 0.764
- Fibo Level 2: 0.618
- Fibo Level 3: 0.5
- Fibo Level 4: 0.382
- Fibo Level 5: 0.236
- These levels determine key areas where price may reverse or pause. You can adjust these ratios based on your trading preferences.
Fibonacci Level Colors:
- Each Fibonacci level can be assigned a different color to make it more distinguishable on your chart:
- Fibo Level 1 Color (default: Yellow)
- Fibo Level 2 Color (default: Orange)
- Fibo Level 3 Color (default: Green)
- Fibo Level 4 Color (default: Red)
- Fibo Level 5 Color (default: Blue)
- You can change these colors to fit your visual preferences or to align with your existing chart themes.
Visibility of Fibonacci Levels:
- You can choose whether to display each Fibonacci level using the following visibility inputs:
- Show Fibo Level 1 (0.764): Display or hide this level.
- Show Fibo Level 2 (0.618): Display or hide this level.
- Show Fibo Level 3 (0.5): Display or hide this level.
- Show Fibo Level 4 (0.382): Display or hide this level.
- Show Fibo Level 5 (0.236): Display or hide this level.
- This allows you to customize the indicator according to the specific Fibonacci levels that are most relevant to your trading strategy.
Background Fill Color
- The background between the Fibonacci levels and price bands can be filled with customizable colors:
- Fill Color for Upper Band & Fibo Level 1: This color will fill the area between the upper band and Fibonacci Level 1.
- Fill Color for Lower Band & Fibo Level 5: This color will fill the area between the lower band and Fibonacci Level 5.
- Adjusting these colors helps highlight critical zones where price may reverse or consolidate.
How to Use AdvancedLines (FiboBands) - PaSKaL in Trading :
Range Trading :
Range traders typically buy at support and sell at resistance. Fibonacci levels provide excellent support and resistance zones in a ranging market.
Example: If price reaches the 0.618 level in an uptrend, it may reverse, providing an opportunity to sell.
Conversely, if price drops to the 0.382 level, a bounce might occur, and traders can buy, anticipating the market will stay within the range.
Trend-following Trading :
For trend-following traders, Fibonacci levels act as potential entry points during a retracement. After a strong trend, price often retraces to one of the Fibonacci levels before continuing in the direction of the trend.
Example: In a bullish trend, when price retraces to the 0.382 level, it could be a signal to buy, as the price might resume its upward movement after the correction.
In a bearish trend, retracements to levels like 0.618 or 0.764 could provide optimal opportunities for shorting as the price resumes its downward movement.
Scalping :
Scalpers focus on short-term price movements. Fibonacci levels can help identify precise entry and exit points for quick trades.
Example: If price is fluctuating in a narrow range, a scalper can enter a buy trade at 0.236 and exit at the next Fibonacci level, such as 0.382 or 0.5, capturing small but consistent profits.
Stop-Loss and Take-Profit Levels :
Fibonacci levels can also help in setting stop-loss and take-profit levels.
Example: In a bullish trend, you can set a stop-loss just below the 0.236 level and a take-profit at 0.618.
In a bearish trend, set the stop-loss just above the 0.382 level and the take-profit at 0.764.
Identifying Reversals and Continuations :
Reversals: When price reaches a Fibonacci level and reverses direction, it may indicate the end of a price move.
Trend Continuation: If price bounces off a Fibonacci level and continues in the same direction, this may signal that the trend is still intact.
Conclusion :
AdvancedLines (FiboBands) - PaSKaL is an essential tool for any trader who uses Fibonacci retracements in their trading strategy. By automatically plotting key Fibonacci levels, this indicator helps traders quickly identify support and resistance zones, forecast potential reversals, and make more informed trading decisions.
For Trend-following Traders: Use Fibonacci levels to find optimal entry points after a price retracement.
For Range Traders: Identify key levels where price is likely to reverse or bounce within a range.
For Scalpers: Pinpoint small price movements and take advantage of quick profits by entering and exiting trades at precise Fibonacci levels.
By incorporating AdvancedLines (FiboBands) - PaSKaL into your trading setup, you will gain a deeper understanding of price action, improve your decision-making process, and enhance your overall trading performance.

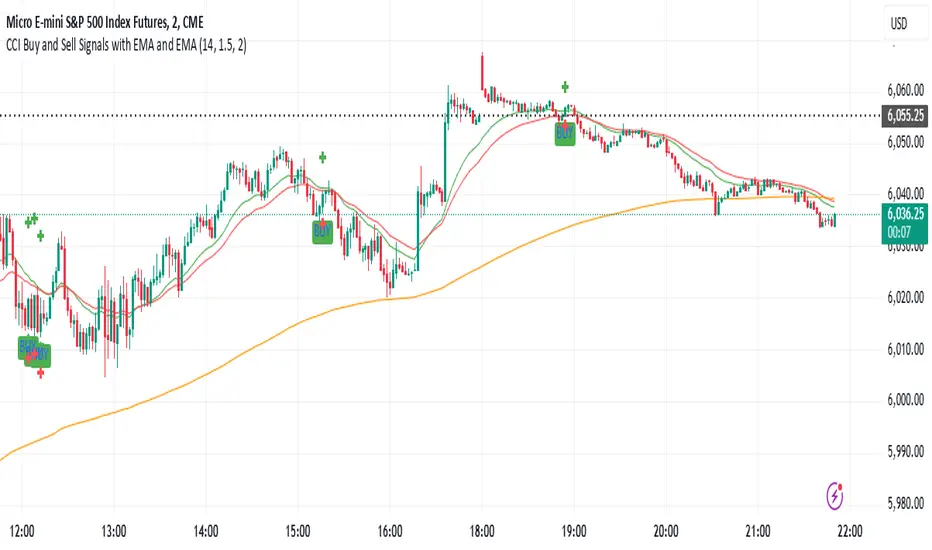
CCI Buy and Sell Signals with 20/30 EMACCI Buy and Sell Signals with EMA and ATR Stop Loss/Take Profit
This indicator is designed to identify buy and sell signals based on a combination of the Commodity Channel Index (CCI) and Exponential Moving Averages (EMA). It also includes an optional ATR-based stop loss and take profit system, which is useful for traders who want to manage their trades with dynamic risk levels.
Features:
CCI Buy and Sell Signals:
Buy Signal: A buy signal is triggered when the CCI crosses up through -100 (from an oversold condition), the 20-period EMA is above the 30-period EMA, and the price is above the 200-period EMA. This suggests that the market is entering an upward trend.
Sell Signal: A sell signal is triggered when the CCI crosses down through +100 (from an overbought condition), the 20-period EMA is below the 30-period EMA, and the price is below the 200-period EMA. This suggests that the market is entering a downward trend.
Exponential Moving Averages (EMA):
The script plots three EMAs:
20-period EMA (Green): Used to identify short-term trends.
30-period EMA (Red): Used to capture medium-term trends.
200-period EMA (Orange): A long-term trend filter, with the price above it generally indicating bullish conditions and below it indicating bearish conditions.
ATR-Based Stop Loss and Take Profit:
Optional Feature: The ATR (Average True Range) indicator can be used to set stop loss and take profit levels based on market volatility.
Stop Loss: Set at a multiple of the ATR below the entry price for long positions and above the entry price for short positions.
Take Profit: Set at a multiple of the ATR above the entry price for long positions and below the entry price for short positions.
Customizable: You can adjust the ATR length, Stop Loss Multiplier, and Take Profit Multiplier through the settings.
Dots: The stop loss and take profit levels are plotted as dots on the chart when the ATR feature is enabled.
Alert Conditions:
Buy Signal Alert: Triggered when a buy signal occurs based on CCI crossing up -100 and other conditions being met.
Sell Signal Alert: Triggered when a sell signal occurs based on CCI crossing down +100 and other conditions being met.
Any Signal Alert: This is a combined alert that triggers for either a buy or sell signal. It helps you stay updated on both types of signals simultaneously.
How to Use:
The indicator will plot buy and sell arrows on the chart, giving clear entry points for trades based on CCI and EMA conditions.
The ATR stop loss and take profit dots (when enabled) provide automatic risk management levels, adjusting dynamically with market volatility.
Traders can customize the ATR settings to fine-tune their stop loss and take profit levels, making this strategy adaptable to different trading styles and market conditions.
All-in-One BB Stoch RSI + PSAR + Keltner + ADX + Trailing StopThis invite-only indicator combines multiple advanced tools into a single script, generating buy/short signals alongside comprehensive alerts. Priced at just $25/month, it’s ideal for both manual trading and integration with bots.
Key Features & Alerts
Buy & Short Signals
Quickly identify potential long or short entries.
Three Take-Profit (TP) Lines
Long: After a BUY signal, three lines appear (TP1, TP2, TP3), allowing you to take partial profits—e.g., 30%, 30%, 30%—and keep the remaining 10% to trail.
Short: Similarly, after a SHORT signal, three TP lines help you scale out as price moves in your favor.
Stop-Loss Line (Based on Bollinger Width)
Precisely calculates a stop-loss distance using Bollinger Band width (a percentage below for longs or above for shorts).
Trailing Stop-Loss
Any remaining position can be trailed under (or above) Parabolic SAR, Keltner Channels, and Bollinger, with an extra 0.2% margin for added caution.
ADX + Stoch RSI + RSI (MA)
Filter out weak trends, gauge volatility, and confirm overbought/oversold regions in real time.
Compatible With Trading Bots
Built-in alerts can be connected to bot logic (via webhooks), enabling automated management of entries, TPs, stop-losses, and trailing stops.
Why Use This Indicator?
All-in-One Script: Eliminates chart clutter by merging multiple indicators into one.
Partial Take-Profits: Clearly defined TP1, TP2, TP3 lines help you lock in gains progressively.
Enhanced Risk Control: Stop-loss and trailing stop lines update automatically, keeping your trades protected.
Easy Bot Integration: Perfect for traders wanting direct alerts or automated trading setups.
Invite-Only for Exclusive Access: Maintain a competitive edge with protected source code.
How to Use:
Add to Chart
After access is granted, go to Indicators → Invite-Only Scripts and select this script.
Enable Specialized Alerts
Receive notifications for Buy/Short signals, the three TP lines, Stop-Loss, and Trailing Stop events.
Scale Out or Automate
Manually close partial positions at the TP lines (e.g., 30% each time) and let the remaining 10% trail for bigger moves.
Or link these alerts to a trading bot for fully automated position management.
Price: $25/month
Interested? Contact me (via direct message or email) for more details and to subscribe. Experience clearer charts, timely signals, and robust risk management in one invite-only package!
Reversal rehersal v1This indicator was designed to identify potential market reversal zones using a combination of RSI thresholds (shooting range/falling range), candlestick patterns, and Fair Value Gaps (FVGs). By combining all these elements into one indicator, it allow for outputting high probability buy/sell signals for use by scalpers on low timeframes like 1-15 mins, for quick but small profits.
Note: that this has been mainly tested on DE40 index on the 1 min timeframe, and need to be adjusted to whichever timeframe and symbol you intend to use. Refer to the backtester feature for checking if this indicator may work for you.
The indicator use RSI ranges from two timeframes to highlight where momentum is building up. During these areas, it will look for certain candlestick patterns (Sweeps as the primary one) and check for existance of fair value gaps to further enhance the hitrate of the signal.
The logic for FVG detection was based on ©pmk07's work with MTF FVG tiny indicator. Several major changes was implemented though and incorporated into this indicator. Among these are:
Automatically adjustments of FVG boxes when mitigated partially and options to extend/cull boxes for performance and clarity.
Backtesting Table (Experimental):
This indicator also features an optional simplified table to review historical theoretical performance of signals, including win rate, profit/loss, and trade statistics. This does not take commision or slippage into consideration.
Usage Notes:
Setup:
1. Add the indicator to your chart.
2. Decide if you want to use Long or Short (or both).
3. If you're scalping on ie. 1 min time frame, make sure to set FVG's to higher timeframes (ie. 5, 15, 60).
4. Enable the 'Show backtest results' and adjust the 'Signals' og 'Take profit' and 'Stop loss' values until you are satisfied with the results.
Use:
1. Setup an alert based on either of the 'BullishShooting range' or 'BearishFalling range' alerts. This will draw your attention to watch for the possible setups.
2. Verify if there's a significant imbalance prior to the signal before taking the trade. Otherwise this may invalidate the setup.
3. Once a signal is shown on the graph (either Green arrow up for buys/Red arrow down for sells) - you should enter a trade with the given 'Take profit' and 'Stop loss' values.
4. (optional) Setup an alert for either the Strong/Weak signals. Which corresponds to when one of the arrows are printed.
Important: This is the way I use it myself, but use at own risk and remember to combine with other indicators for further confluence. Remember this is no crystal ball and I do not guarantee profitable results. The indicator merely show signals with high probability setups for scalping.

Strategy Development Environment [BerlinCode42]Happy Trade,
Intro
What is New
Algebraic/Boolean Equation
Instruction Set for The Algebraic/Boolean Equation
Example
Usage
Settings Menu
Declaration for Tradingview House Rules on Script Publishing
Disclaimer
Conclusion
1. Intro
This is a rich equipped fork of my previous "Backtest any Indicator v5". And serves as the fitting backtester and trade strategy creation tool for my upcoming ANN Indicators (artificial neural network).
As the previous version this script has no trade signal generating code. The trade signals comes in by the five user settable input slots where the user plug-in external indicators. The final trade siganls go long etc are defined by a algebraic/boolean equation typed in as text in 4 terminals as shown in Image 0 . With this algebraic/boolean equations input the user can setup any trade logic as complex and fast and easy as never seen before here on TradingView.
Image 0
2. What is new
Input algebraic/boolean equations in text-form for go long, go short, exit long & exit short
Five input slots for external indicator signals
Equation tester
User settable signal delay for enter and exit trades
User selectable alternating trades filter
User settable exit long = enter short
Intrabar or trade only on bar closing
Time filter with duration input
User settable UTC Adjustment
Long and short trades possible
Two Take Profits with quantity setting
Trailing Stop
Webhook connection
3. Algebraic/Boolean Equation
This is where the magic happens. Unlike other backtesters that rely on drop-down menus to define trade signal equations—thus limiting the number of input signals and the complexity of logic—this script uses a string interpreter to solve equations. With this, you can develop your trade logic equations and add signals or conditions simply by writing them down in algebraic/boolean form.
The instruction set for this interpreter includes not only external input signals but also several internal values. These include BarTime, BarIndex, Open, High, Low, Close, True Range, Minimal Tick, Volume, and a signal that indicates whether there is an open trade (long, short, or none). You can also reference the values of past bars for all these inputs and, of course, use constant values in your equations. There is a sad limitation: Only one past bar value per equation is practicable. If you use more, errors can occur. It seems to be caused by the pipe line architecture of the parallel computing. In any attempt to solve this issue an older function call result was hand over.
The implemented functions cover a wide range of algebraic and boolean operations. A boolean "true" is represented by all values greater than zero, while "false" is represented by zero or values less than zero.
4. Instruction set for the Algebraic/Boolean Equation
There are functions that accept either two input values or one input value. The general form is (XandY) or (notX), where X and Y can be any input slot, predefined value, constant, or another sub-equation. Functions are always written in lowercase, while input slots and predefined values use uppercase letters.
Each sub-equation must be enclosed in parentheses, e.g., (A+B). Without proper use of parentheses, the interpreter cannot determine which function to calculate first. Negative constants must be expressed by subtracting from zero (e.g., (0-3.14)), so careful attention is required.
Here are some examples that demonstrate both incorrect and correct notations:
incorrect correct
(A+B*C) (A+(B*C))
(A+B+D+E) (A+(B+(D+E)))
(-20>A) ((0-20)>A)
(A*-B) (A*(0-B))
(AnotB) (Aand(notB))
ABS(a-b) (abs(A-B))
The correct usage ensures the interpreter calculates in the intended order.
And here comes the complete Instruction Set:
Addition: (A+B)
Subtraction: (A-B)
Multiplication: (A*B)
Division: (A/B)
Absolut value: (absA)
Power of: (A^B)
Natural Logarithm: (logA)
Lowest value of Low of last x bars: (lotx)
Highest value of High of last x bars: (hotx)
Modulo, Remainder of a Division: (A%B)
Round: (rndA)
round to ceil: (ceiA)
Round to floor: (floA)
Round to next minimal tick: (mitA)
EMA of A of last 3 bars: (e03A)
EMA of A of last 7 bars: (e07A)
EMA of A of last 10 bars: (e10A)
EMA of A of last 20 bars: (e20A)
EMA of A of last 50 bars: (e50A)
Smaller then: (AB)
Equal to: (A==B)
Unequal to: (A!=B)
And: (AandB)
Or: (AorB)
Exclusive Or: (AxorB)
Not: (notA)
Past bar value: (A ) ,whereby x can be 1,2,3,...,barIndex-1
Bar time: (T)
Bar index: (I)
Opening Price of Bar: (O)
Highest Price of Bar: (H)
Lowest Price of Bar: (L)
Closing Price of Bar: (C)
Min tick value for the current symbol: (K)
Trade Volume: (V)
True Range: (R)
Is Money invested: (M) ,Long position: M=1,
Short position: M=-1,
No position: M=0
Reminder: if you wanna replace A or B above don't forget the parentheses. So if you have (logA) and wanna replace A with D+F so the correct replacement would be (log(D+F)).
In the following there are some examples of popular bar patterns and useful filters:
Doji: ((abs(O-C))<(10*K))and((H-L)>(100*K))
green Hammer: (((H-C)<(5000*K))and(((O-L)/2)>(abs(O-C)))
Up trend: (C>(e10H))
Down trend: (C<(e10L))
cool down 7 bars: (( any buy condition )and((e07(absM))==0))
possible Pivot High: (H==(hot30))and((CC))
possible Pivot Low: (L==(lot30))and((C>H )or(O0)), goShort ((A>0)and((A )<0)), Enter Signal delay=0, Exit Signal delay=0, Alternate Trades=true
take profit 1 =0.4% (30%), take profit 2 =0.7%, trailing stop loss=0.2%, intrabar, start capital=1000$, qty=5%, fee=0.05%, no Session Filter
Image 1
6. Usage
First you need to attach some signals from external Indicators. In the example above we use the Stochastic RSI indicator from TradingView. Load the Stochastic RSI indicator to the chart. Then you go to the settings menu of this script, choose in the drop-down menu of Input A the signal .
In case you wanna use a signal which is not in the drop-down menu of Input A do the following:
1) You need to know the name of the boolean (or integer) variable of your indicator which hold the desired signal. Lets say that this boolean variable is called BUY. If this BUY variable is not plotted on the chart you simply add the following code line at the end of your pine script.
For boolean (true/false) BUY variables use this:
plot(BUY ? 1:0,'Your buy condition hold in that variable BUY',display = display.data_window)
And in case your script's BUY variable is an integer or float then use instate the following code line:
plot(BUY ,'Your buy condition hold in that variable BUY',display = display.data_window)
2) Probably the name of this BUY variable in your indicator is not BUY. Simply replace in the code line above the BUY with the name of your script's trade condition variable.
3) Do the same procedure for your SELL variable. Then save your changed Indicator script.
4) Then add the changed Indicator script from step before and this backtester script to the chart ...
5) and go to the settings of it. Choose under "Settings -> Input A " your Indicator. So in the example above choose .
The form is usually: ' : BUY'. Then you see something like Image 1
6) Decide about each trade logic for Go Long and Go Short . In this Example we use for GoLong if "Stoch RSI: K" is smaller then 20. The "Stoch RSI: K" we already loaded it in input A. So we set under Go Long (A<20) and set Enter Signal Delay to 0.
Now we setup Go Short if "Stoch RSI: K" is bigger then 80. So we set under Go Short A>80. Enter Signal Delay is already set.
7) For the Exit conditions you can choose (trailing) Stop loss or Take Profit or Exit by Indicator Signal. What ever comes first triggers the exit. If you like to use an EMA Indicator for the Exit by Indicator just load it in a free input slot B, D, E, F or use the inbuild EMA. For this example we use the inbuild EMA of the last 7 values of close. It is called by the following equation: (e07C). So to exit a long trade when the close price crossunder this EMA you have to type in Exit Long ((e07C)>C). For exit a short trade enter in Exit Short ((e07C)
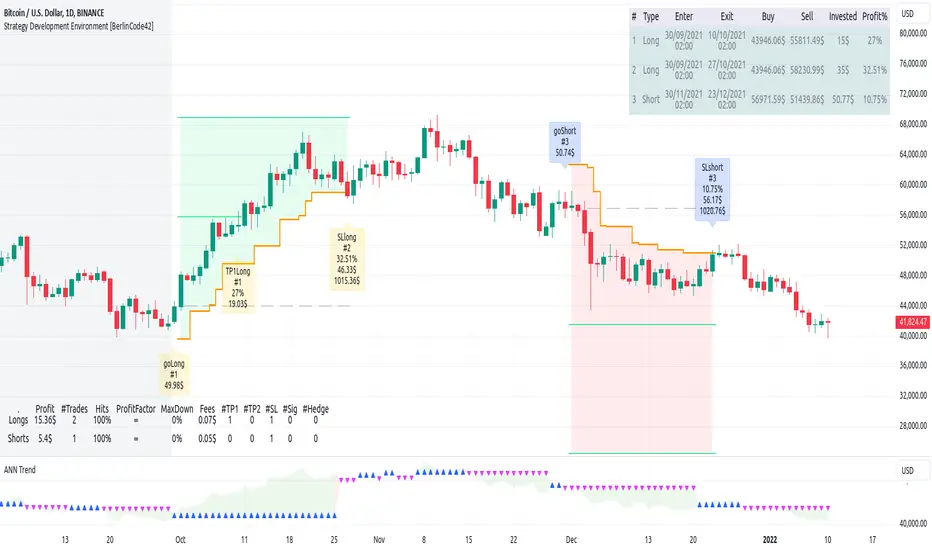
Risk Reward CalculatorThis indicator provides a powerful and flexible tool to calculate and visualize key risk and reward metrics for your trading strategies. By inputting essential parameters like account size, risk tolerance, entry price, and stop loss, you can gain valuable insights into potential profit and loss scenarios.
Key Features:
Risk and Reward Analysis: Accurately calculates risk and reward ratios, helping you assess the potential payoff of each trade.
Position Sizing: Determines optimal position sizes based on your risk tolerance and account size.
Stop-Loss and Take-Profit Levels: Calculates dynamic stop-loss and take-profit levels based on risk-reward ratios.
Selling into Strength: Provides guidance on selling portions of your position at favorable price levels to secure profits and reduce risk.
Customizable Table: A highly customizable table displays all relevant information in a clear and concise format.
Inputs:
Trade Settings: Allows choosing between long, short, or both positions.
Account Size: Sets the total capital available for trading.
Risk Percentage: Defines the percentage of the account risked per trade.
Risk Amount: Calculates the actual risk amount based on account size and risk percentage.
Entry Price: Sets the entry price for the trade.
Actual Units: Defines the actual number of units purchased or sold.
Stop Loss at Actual Price (Exit): Calculates stop loss based on entry price and risk amount.
Parts: Sets the number of parts to split the position for selling into strength.
Selling into Strength: Calculates the quantity per part for selling.
Table Position: Defines the location of the table displaying calculations.
Size: Sets the size of the text in the table.
R Multiple Value: Defines the risk-reward multiple used for calculations.
No. of R Multiples: Sets the number of R multiples to show in the table.
How to Use:
Input Parameters: Enter your account size, risk tolerance, entry price, and other relevant information.
Analyze Metrics: Review the calculated risk, reward, position size, and stop-loss levels.
Make Informed Decisions: Use the insights gained to make informed decisions about your trades.
Benefits:
Improved Risk Management: By understanding your risk exposure, you can make more prudent trading decisions.
Enhanced Profit Potential: By identifying optimal entry and exit points, you can maximize your potential profits.
Increased Trading Confidence: The clear and concise presentation of information empowers you to trade with greater confidence.
Elevate your trading strategy with the Risk Reward Calculator.

ICTProTools | ICT Insight - Time & Price Zones🚀 INTRODUCTION
The Time and Price Zones indicator builds upon the foundational concepts of ICT (Inner Circle Trader) and Smart Money Concepts (SMC). These methodologies analyze the behavior of institutional traders (known as "smart money") by focusing on liquidity, key price levels, and market timing.
Liquidity refers to areas with high concentrations of pending orders (stops, take-profits, entries) in the market. Large institutions efficiently need to execute their massive orders without causing excessive slippage. To achieve this, they strategically create and exploit liquidity pools by driving the price toward areas where retail traders cluster their positions.
Then, through "liquidity grabs" or "stop hunts,” institutions accumulate or distribute positions at optimal prices . This strategy allows them to fill large orders with minimal market impact, typically clearing out retail traders' positions before the price reverses.
This indicator helps traders apply these principles by merging time-based and price-based analysis tools for better market understanding. By combining high-impact sessions like Kill Zones with pivotal price markers such as Previous Highs and Lows, traders can see where institutional activity intersects with liquidity pools, improving their decision-making.
This powerful combination allows users to monitor market dynamics in real time, helping them spot sentiment shifts and identify crucial turning points more effectively.
💎 FEATURES
Kill Zones
Kill Zones are critical periods of the trading day characterized by heightened institutional activity, resulting in increased liquidity and significant price movements. By recognizing these zones, you can strategically focus your efforts on the most advantageous moments for trading.
The Asian Session , which runs from 5 PM to 1 AM New York time, serves as an essential liquidity provider before the onset of more volatile trading periods. This session is intricately linked to the Smart Money Tool (SMT - See below), as the highs and lows established during this period provide foundational liquidity levels. You can set alerts when these levels are breached , allowing you to stay informed without constant chart monitoring and make timely trading decisions.
Transitioning into the London Kill Zone from 2 to 5 AM New York time marks the beginning of the European session, often associated with increased volatility. Following this, the New York Kill Zone , occurring from 7 to 10 AM , sees significant overlap between the London and New York sessions, where liquidity flows intensify and frequently correlate with notable price reversals. Finally, the London Close from 10 to 12 PM signifies the end of the European session, often ending the day with a retracement in the daily range.
Thanks to the timezone you can select relative to a region, Kill Zones will automatically adapt to time changes throughout the year and between different brokers , ensuring accurate Kill Zone timings without manual adjustments.
Incorporating our advanced Kill Zones indicator into your trading strategy gives you unparalleled insights and enhanced functionality. With integrated alerts for breaches of key levels, you can stay informed and ready to act without the need for constant chart monitoring, allowing you to focus on executing your trading strategies effectively.
We can see on this chart the identified Kill Zones during the trading day on EURUSD , including the Asian Session in gray, which tends to consolidate slightly (creating liquidity), the London Kill Zone in orange, which tends to move fast, often taking Asian quickly, the New York Kill Zone in green, with always a lot of movements, and the London Close in blue, seeming rather to retrace.
The midline indicates the 50% mark of the session, serving as a reference point for potential price reactions. Additionally, the highs and lows established during the Asian Session are linked to the Smart Money Tool (SMT) and can trigger alerts when breached. Here, you could have received an alert when Asian Low (marked AL) and Asian High (marked AH) were swept.
Previous & Open Levels
Previous and Open levels are key elements in ICT methodology, showing important price points from major timeframes (Daily, Weekly, Monthly). These levels (Previous High, Low, Open, and their separators) help traders understand price dynamics and anticipate market shifts.
The Previous levels connect directly to the Smart Money Tool (SMT - See below) as they provide foundational liquidity levels. In ICT methodology, previous are levels where many traders place their Stop Loss, thus creating liquidity. This helps you understand potential market reactions and whether prices will likely continue their trend or reverse.
You’ll be instantly notified whenever the price interacts with any of these Previous levels. This means you can stay informed about critical market movements without the need to monitor your charts constantly.
The indicator also displays Opening prices and includes separators for daily, weekly, and monthly levels, offering a clear market overview.
Open levels can act as simplified indicators of Premium and Discount Zones. To be above the opening price can be considered as the Premium Zone , where the market offers higher prices, typically suitable for selling opportunities. Conversely, to be below this price can be considered as the Discount Zone , where prices are relatively lower, offering potential buying opportunities.
These visual elements help you identify crucial market zones that reflect both past price action and current market dynamics.
Our indicator offers you the exclusive ability to integrate the True Day Range, as described by ICT. Based on institutional logic, this concept defines the trading day starting at 00:00 New York time. You can adapt this flexible feature to match your trading style and analysis needs.
By incorporating our advanced Previous levels indicator into your trading arsenal, you gain powerful insights and enhanced functionality.
The chart above displays key Previous and open levels on EURUSD , including the Month, Week, and Day lines, along with separators for enhanced clarity. All levels are based on the True Day Range Mode. The notes indicate significant price points, highlighting how the price interacts with these important levels, which helps us to understand it…
We can start with the biggest liquidity, the Previous Month. In this example, we can see the PMH, and the price seems to have used this level as a reversal point. The PM levels are indeed significant liquidity zones. We can observe the creation of wicks that interact with this level, signaling a liquidity grab.
Following this, the price drops quickly before rebounding, creating a liquidity range, that will probably be liquidated then… This is why it rises again to form what is now the PDH (Previous Day High), using it as liquidity (inducement) while using the PWH (Previous Week High) as a rebound level. The PWH is indeed a High Resistance (HR) area since there is only a few liquidity at this point thanks to the liquidity grab. The price has no reason to move higher.
Looking ahead, we can forecast that the price may continue its decline, potentially targeting lower liquidity levels. There is likely additional liquidity beneath the current range, particularly near the PDL (Previous Day Low) and PWL (Previous Week Low).
Additionally, we can note that at this point, the price was above the D.O.P (Daily Open) and W.O.P (Weekly Open), areas where selling would be more favorable. The price reacts significantly around these levels, creating large wicks, demonstrating their importance.
SMT Dashboard (Smart Money Tool)
The Smart Money Tool (SMT) is a powerful concept within the ICT methodology that enables you to compare various assets based on liquidity uptake from significant price levels.
By utilizing the SMT, you can analyze any asset , whether it’s a currency pair, stock, cryptocurrency, or other financial instruments. The dashboard helps you identify the strongest and weakest assets by analyzing their interactions with critical liquidity levels and identifying divergences , including those related to the Previous Month, Previous Week, Previous Day, and Asian Session Highs and Lows. By doing so, he identifies the most bullish symbol. It will therefore tend to rise more easily, or at least fall less, than the other one.
The SMT includes alert functionality that notifies you whenever a new SMT is created or has changed , allowing you to stay informed about which asset is currently the strongest. This means you can react promptly to market changes without constantly monitoring your charts.
Additionally, since the SMT relies on the Previous levels, it is influenced by the selected mode, whether based on traditional Previous levels or the True Day Range . This flexibility ensures that you are using the most relevant information available for your trading decisions. Asian High and Asian Low levels are also calculated according to the schedules configured in the Kill Zones section.
In summary, the Smart Money Tool displays the strongest and weakest assets based on liquidity uptake, providing you with clear information on which asset to prioritize, so you can maximize your potential profits. By incorporating this concept into your approach, you align your decisions with prevailing market dynamics, offering you unparalleled insights and features tailored to enhance your trading strategy.
This chart displays the Smart Money Tool (SMT) dashboard on the GBPUSD symbol, which compares the liquidity uptake for EURUSD and GBPUSD pairs. The indicator shows that both Previous Month's and Week's High and Low were taken for both pairs. However, the Asian High (AH) has been breached on GBPUSD but not on EURUSD, while the Asian Low (AL) has been taken by EURUSD. As a result, GBPUSD is identified as the stronger asset, indicating that traders should focus on buying opportunities with GBPUSD rather than EURUSD. This analysis helps traders prioritize the best symbol for their strategies based on the most relevant liquidity divergences.
✨ SETTINGS
Kill Zones: Customize the display options for the Asian (with lines), London, New York, and London Close Kill Zones. Configure timezone options, midlines, and color preferences.
Previous & Open Levels: Adjust how Previous High/Low levels, Open and separators are displayed. Select between Classic or True Day Range Mode based on your trading preferences.
SMT: Choose the correlated assets for the SMT comparison and select which liquidity (Monthly, Weekly, Daily, Asian) to use and display. Configure settings like liquidity sweeps and strongest pair emojis.
Alerts: Configure alerts for key events such as the Asian High/Low or Previous Levels liquidity sweep, and SMT divergences.
🎯 CONCLUSION
The Time and Price Zones indicator offers a practical and insightful approach to market analysis by combining major principles of ICT and Smart Money Concepts into a cohesive tool. It empowers traders to understand key price levels, liquidity dynamics, and institutional activity with ease. By helping traders avoid being the liquidity of the market and instead align with institutional flows, the indicator can significantly enhance performances. While its features provide a valuable edge, it’s essential to remember that none should be used on its own and many more factors go into being a profitable trader.

ViPlay Signal Indicator ProViPlay Signal Indicator Pro is an innovative tool designed for traders looking to enhance the accuracy and effectiveness of their trading decisions. It provides a comprehensive approach to market analysis, generating informative trend change signals based on in-depth market analysis and advanced algorithms.
By adjusting the RISK parameter, traders can customize the signal frequency to match their preferences and trading strategies. This versatile tool is suitable for various trading styles and assets, including Forex, stocks, cryptocurrencies, and commodities, helping traders make informed decisions across any market.
Key Features of the Indicator
1. The RISK parameter controls the frequency of trend change signals. The lower the value, the more frequent the signals will appear, and vice versa. This gives users flexibility in adjusting the indicator according to their strategy.
2. Signal Generation:
Modified Range Oscillator (MRO):
This is the core element of the indicator's functionality. It works in two stages:
– MRO1: This stage focuses on short-term price movements, identifying volatility peaks and potential reversal points that may indicate an upcoming trend change. It is particularly useful for traders looking for quick opportunities.
– MRO2: This stage analyzes long-term trends, filtering out minor market fluctuations. It helps traders focus on more stable movements, reducing the impact of noise.
Williams %R:
This indicator works in conjunction with MRO, confirming reversal points by analyzing market overbought or oversold conditions. This reduces the likelihood of false signals, providing additional confidence in forecasts.
The combination of MRO and Williams %R ensures that traders receive reliable and timely signals, reflecting both immediate market conditions (via MRO1) and long-term trends (via MRO2), making the tool suitable for different trading horizons.
How the components work together:
MRO performs the primary task of identifying potential trend reversal points, dividing the analysis into short-term and long-term perspectives. In the first stage (MRO1), it evaluates market volatility and predicts potential reversals. In the second stage (MRO2), it filters out random fluctuations, providing more stable signals. Williams %R acts as an additional layer of confirmation: if MRO indicates a trend reversal and Williams %R confirms it by showing overbought or oversold conditions, the signal is considered more reliable.
In an uptrend, MRO1 indicates a reversal when the price reaches a local high, while MRO2 confirms the trend's stability. Williams %R further validates this signal, reducing the likelihood of a false entry. In a downtrend, the indicator works similarly, helping traders lock in profits or open short positions.
Williams %R:
Complements MRO by assessing market conditions for overbought or oversold levels. If MRO1 indicates a reversal and Williams %R confirms it, the likelihood of a false signal is significantly reduced.
RISK parameter:
Controls the sensitivity of MRO1 to changes in volatility. At higher values, minor fluctuations are filtered out, which is useful for long-term strategies. At lower values, the signals become more frequent, making it suitable for scalping.
3. Visual Signals:
– Green Up Arrow: Marks potential upward trends.
– Red Down Arrow: Marks potential downward trends, helping traders identify possible entry points
4. How levels are calculated:
Support and resistance levels are calculated based on historical price data. Specifically:
Support 1: This is the minimum price (low) over the last 200 bars.
Support 2: This is the minimum price over the last 500 bars.
Support 3: This is the minimum price over the last 1000 bars.
Resistance 1: This is the maximum price (high) over the last 200 bars.
Resistance 2: This is the maximum price over the last 500 bars.
Resistance 3: This is the maximum price over the last 1000 bars.
The levels are not static; they update with every bar, allowing traders to see current price zones. Users can enable or disable the display of different levels through parameters.
Support and resistance levels help traders identify key points for potential price reversals. The indicator automatically calculates these levels and displays them on the chart, allowing the user to use them for making trading decisions.
How to Use ViPlay Signal Indicator Pro
1. Add the Indicator to the Chart
2. Choose a Timeframe suitable for your trading strategy. The indicator supports all timeframes.
3. Customize Parameters:
Adjust the RISK parameter to control signal frequency (1–49, default 49).
Set the Take-Profit percentage (default 7%).
Configure moving average periods.
Adjust support and resistance levels.
4. Analyze:
– Use informative buy and sell signals based on market analysis.
– Use a customizable Take-Profit level based on the entry price to determine optimal exit points.
– Utilize key support and resistance levels on the selected timeframe to identify optimal entry and exit points.
– The information in the table indicates the strength of the current trend. When the value reaches 0 or 100, the trend changes.
* Note that the indicator serves as an analytical tool and does not replace sound trading strategies.
Uniqueness and Originality
1. Innovative Algorithms
The combination of Modified Range Oscillator (MRO) and Williams %R is not a standard pairing in trading tools. The two-phase approach of MRO provides users with a comprehensive understanding of the market, offering information on both short-term fluctuations and long-term trends, while Williams %R serves as an additional filter to eliminate false signals.
2. The indicator uses mathematical functions such as True Range (TR) to analyze volatility and identify potential entry and exit points.
3. Versatility
The indicator supports all financial market assets, including Forex, stocks, cryptocurrencies, and commodities. It adapts to any trading style or strategy. Additionally, it is compatible with all timeframes, benefiting both short-term and long-term traders.
4. Ease of Use
5. All elements of the indicator can be customized or hidden according to the user’s needs, making it a convenient tool for market analysis. The indicator is compatible with all financial market assets, including Forex, stocks, cryptocurrencies, and commodities.
Important Notes
This indicator is an analytical tool and does not guarantee profits. Signals should be used alongside personal analysis and risk management strategies. Traders should note that no indicator can provide 100% accurate predictions, and there is always a possibility of false signals.

ATR-based TP/SL with Dynamic RREnglish
This indicator combines the power of the Average True Range (ATR) with dynamic calculations for Take Profit (TP) and Stop Loss (SL) levels, offering a clear visualization of trading opportunities and their respective Risk-Reward Ratios (RRR).
Features:
Dynamic TP/SL Calculation:
TP and SL levels are derived using user-defined ATR multipliers for precise positioning.
Multipliers are flexible, allowing traders to adjust according to their strategies.
Risk-Reward Ratio (RRR):
Automatically calculates and displays the RRR for each trade signal.
Helps traders quickly assess if a trade aligns with their risk management plan.
Entry Conditions:
Buy signals occur when the closing price crosses above the 20-period Simple Moving Average (SMA).
Sell signals occur when the closing price crosses below the 20-period SMA.
Visual Aids:
Red and green lines indicate Stop Loss and Take Profit levels.
Blue and orange labels show the RRR for long and short trades, respectively.
How It Works:
The indicator uses the ATR to calculate TP and SL levels:
TP: Adjusted based on the desired Risk-Reward Ratio (RR).
SL: Proportional to the ATR multiplier.
Entry signals are plotted with "BUY" or "SELL" markers, while the respective TP/SL levels are drawn as horizontal lines.
Why Use This Indicator?
Perfect for traders who value precise risk management.
Helps identify trades with favorable RRR (e.g., greater than 1.5 or 2.0).
Ideal for swing traders, day traders, and scalpers looking to automate their decision-making process.
Customization:
ATR Length: Control the sensitivity of ATR-based calculations.
ATR Multipliers: Set the TP and SL distances relative to the ATR.
Desired RRR: Define the risk/reward ratio you aim to achieve.
Important Notes:
The indicator does not place trades automatically; it is for visual and analytical purposes.
Always backtest and combine it with additional analysis for best results.
French
Cet indicateur combine la puissance de l’Average True Range (ATR) avec des calculs dynamiques pour les niveaux de Take Profit (TP) et de Stop Loss (SL), tout en offrant une visualisation claire des opportunités de trading et de leurs Ratios Risque/Rendement (RRR).
Fonctionnalités :
Calcul Dynamique des TP/SL :
Les niveaux de TP et SL sont calculés à l'aide de multiplicateurs ATR définis par l’utilisateur pour une position précise.
Les multiplicateurs sont personnalisables pour s'adapter à votre stratégie de trading.
Ratio Risque/Rendement (RRR) :
Calcule et affiche automatiquement le ratio RRR pour chaque signal de trade.
Permet aux traders d’évaluer rapidement si un trade correspond à leur plan de gestion des risques.
Conditions d'Entrée :
Les signaux d'achat apparaissent lorsque le prix de clôture traverse au-dessus de la moyenne mobile simple (SMA) à 20 périodes.
Les signaux de vente apparaissent lorsque le prix de clôture traverse en dessous de la SMA à 20 périodes.
Aides Visuelles :
Lignes rouges et vertes pour indiquer les niveaux de Stop Loss et de Take Profit.
Étiquettes bleues et orange pour afficher le RRR des trades longs et courts, respectivement.
Comment Cela Fonctionne :
L'indicateur utilise l’ATR pour calculer les niveaux TP et SL :
TP : Calculé dynamiquement en fonction du ratio risque/rendement souhaité (RRR).
SL : Proportionnel au multiplicateur ATR défini par l’utilisateur.
Les signaux d’entrée sont représentés par des étiquettes "BUY" ou "SELL", tandis que les niveaux de TP/SL sont tracés sous forme de lignes horizontales.
Pourquoi Utiliser Cet Indicateur ?
Idéal pour les traders soucieux d’une gestion rigoureuse des risques.
Identifie les opportunités de trades avec des RRR favorables (par exemple, supérieurs à 1.5 ou 2.0).
Convient aux swing traders, day traders et scalpeurs souhaitant automatiser leur processus de décision.
Personnalisation :
Longueur de l’ATR : Contrôlez la sensibilité des calculs basés sur l’ATR.
Multiplicateurs ATR : Ajustez les distances TP et SL par rapport à l’ATR.
Ratio RRR souhaité : Définissez le ratio risque/rendement que vous visez.
Remarques Importantes :
Cet indicateur n’exécute pas de trades automatiquement ; il est destiné à un usage visuel et analytique uniquement.
Toujours backtester et combiner avec une analyse supplémentaire pour de meilleurs résultats.
parametre par type de trading:
1. Pour les Scalpers :
Style de trading : Trades rapides sur de petites variations de prix, souvent sur des unités de temps courtes (1 min, 5 min).
Recommandations de paramètres :
ATR Length : 7 (plus court pour réagir rapidement à la volatilité).
Multiplicateur SL : 1.0 (Stop Loss proche pour limiter les pertes).
RR souhaité : 1.5 à 2.0 (bon équilibre entre risque et récompense).
Résultat attendu : Des trades fréquents, avec une probabilité raisonnable de toucher le TP tout en limitant les pertes.
2. Pour les Day Traders :
Style de trading : Trades qui durent plusieurs heures dans la journée, souvent sur des unités de temps moyennes (15 min, 1h).
Recommandations de paramètres :
ATR Length : 14 (standard pour capturer une volatilité modérée).
Multiplicateur SL : 1.5 (Stop Loss à distance raisonnable pour supporter les fluctuations intrajournalières).
RR souhaité : 2.0 à 3.0 (ciblez une bonne récompense par rapport au risque).
Résultat attendu : Moins de trades, mais un RR élevé pour compenser les pertes potentielles.
3. Pour les Swing Traders :
Style de trading : Trades qui durent plusieurs jours, souvent sur des unités de temps longues (4h, 1 jour).
Recommandations de paramètres :
ATR Length : 20 (pour capturer des mouvements de volatilité plus larges).
Multiplicateur SL : 2.0 (Stop Loss large pour supporter des fluctuations importantes).
RR souhaité : 3.0 ou plus (ciblez de gros mouvements de prix).
Résultat attendu : Des trades moins fréquents mais potentiellement très lucratifs.
4. Pour les Actifs Volatils (Crypto, Commodités) :
Problème spécifique : Les actifs volatils ont souvent des mouvements brusques.
Recommandations de paramètres :
ATR Length : 7 ou 10 (plus court pour suivre rapidement les variations).
Multiplicateur SL : 1.5 à 2.0 (assez large pour ne pas être déclenché prématurément).
RR souhaité : 1.5 à 2.0 (favorisez des récompenses réalistes sur des mouvements volatils).
Résultat attendu : Trades qui s’adaptent à la volatilité sans sortir trop tôt.
5. Pour les Marchés Stables (Indices, Actions Blue Chip) :
Problème spécifique : Les mouvements sont souvent lents et prévisibles.
Recommandations de paramètres :
ATR Length : 14 ou 20 (capture une volatilité modérée).
Multiplicateur SL : 1.0 à 1.5 (Stop Loss serré pour maximiser l’efficacité).
RR souhaité : 2.0 à 3.0 (ciblez des ratios plus élevés sur des mouvements moins fréquents).
Résultat attendu : Maximisation des profits sur des tendances claires.
Recommandation Générale :
Si vous ne savez pas par où commencer, utilisez ces paramètres par défaut :
ATR Length : 14
Multiplicateur SL : 1.5
RR souhaité : 2.0

Dynamic TestingInput Parameters
`lookbackPeriod` : Number of candles to check for determining the highest high (resistance) and lowest low (support) levels.
`atrPeriod` : The period for calculating the Average True Range (ATR), a measure of market volatility.
`atrMultiplierSL` : Multiplier to calculate the stop-loss distance relative to the ATR.
`atrMultiplierTP1` and `atrMultiplierTP2` : Multipliers to calculate two take-profit levels relative to ATR.
`rewardToRisk` : The ratio between reward (profit) and risk (stop loss) for trade management.
---
Core Calculations
ATR (Average True Range)
atr = ta.atr(atrPeriod)
ATR is computed using the specified period to gauge price volatility.
Volume SMA
volumeSMA = ta.sma(volume, atrPeriod)
The script calculates the simple moving average of volume over the same period as ATR. This is used as a threshold for validating high-volume scenarios.
---
Support and Resistance Levels
`support` : Lowest price over the last `lookbackPeriod` candles.
`resistance` : Highest price over the same period.
`supportBuffer` and `resistanceBuffer` : These are "buffered" zones around support and resistance, calculated using half of the ATR to prevent false breakouts.
---
Entry Scenarios
Bullish Entry (`isBullishEntry`)
The close is above the buffered support level.
The low of the current candle touches or breaks below the support level.
The trading volume is greater than the `volumeSMA`.
Bearish Entry (`isBearishEntry`)
The close is below the buffered resistance level.
The high of the current candle touches or exceeds the resistance level.
The trading volume is greater than the `volumeSMA`.
---
Box Visualization
Bullish and Bearish Boxes
Bullish Box (`bullishBox`):
- A green, semi-transparent rectangle around the support level to highlight the bullish entry zone.
- Dynamically updates based on recent price action.
Bearish Box (`bearishBox`):
- A red, semi-transparent rectangle around the resistance level to highlight the bearish entry zone.
- Adjusts similarly as price evolves.
---
Stop Loss and Take Profit Calculations
Bullish Trades
Stop Loss (`bullishSL`): Calculated as support - atrMultiplierSL * ATR .
Take Profit 1 (`bullishTP1`): support + rewardToRisk * atrMultiplierTP1 * ATR .
Take Profit 2 (`bullishTP2`): support + rewardToRisk * atrMultiplierTP2 * ATR .
Bearish Trades
Stop Loss (`bearishSL`): resistance + atrMultiplierSL * ATR .
Take Profit 1 (`bearishTP1`): resistance - rewardToRisk * atrMultiplierTP1 * ATR .
Take Profit 2 (`bearishTP2`): resistance - rewardToRisk * atrMultiplierTP2 * ATR .
---
Visualization for Key Levels
Bullish Scenario
Green lines represent `bullishTP1` and `bullishTP2` for profit targets.
A red line indicates the `bullishSL` .
Labels like "TP1," "TP2," and "SL" dynamically appear at respective levels to make the targets and risk visually clear.
Bearish Scenario
Red lines represent `bearishTP1` and `bearishTP2` .
A green line marks the `bearishSL` .
Similar dynamic labeling for `TP1` , `TP2` , and `SL` at corresponding bearish levels.
---
Dynamic Updates
Both the entry boxes and key level visualizations (lines and labels) adjust dynamically based on real-time price and volume data.
---
Purpose
Identify high-probability bullish and bearish trade setups.
Define clear entry zones (using boxes) and exit levels (TP1, TP2, SL).
Incorporate volatility (via ATR) and volume into decision-making.
---
Technical Summary
Dynamically visualize support/resistance levels.
Set risk-managed trades using ATR-based stop-loss and profit levels.
Automate visual trade zones for enhanced chart clarity.
---

Roman's Ranges(GOLD FUTURES)This indicator provides the user with Gold Future's previous day’s range and how long it took for the price to reach its first extreme for the day. This information is used to predict the most probable daily direction trend and estimate how long you should expect to hold your winning trade. The distance and time are based on the market open candle (6:30 am). It measures from the retracement wick of the candle to the last 5m close of the day’s first extreme low or high point. It also includes that distance in pts.
Previous market data does not guarantee future results, however, you can leverage the knowledge of the previous day’s ranges to set reasonable take profit levels and when your target is not met automatically, you know how long it took on the previous day to reach the day’s first low/high. If you are nearing that amount of time and your trade is not as profitable as expected, it is easier to get out with less profits using this estimated time rather than hoping the market closes in your favor.
Markets go through cycles and it can be difficult to trade them all if you have a fault expectation how how far the price is expected to move. Price tends to deviate slowly from the average ranges slightly day after day, but you can expect an average range to prevail throughout the week +/- 3 points. It can be very easy to be stuck on 5-point take-profit levels that you don’t pay attention to the average range being twice or three times that distance. The same can be said for the opposite scenario with having higher profit expectations than reasonably possible.
This indicator and my statements are not financial advice. This is meant for educational purposes only.

All-Market Monitor 中文說明
全能市場監測者是一款多功能指標,為交易者提供全面的市場監控,包含價格趨勢、移動平均線、交易量及風險管理等數據。此指標支援多項參數設置,方便交易者根據需求調整配置,實現更靈活的交易策略。
參數說明:
SMA長度設定:可調整7條不同長度的SMA (簡單移動平均線),提供不同時間框架的趨勢信息。
交易量倍數:設置交易量的倍數,強調異常的交易量變化。當交易量倍數達到指定條件時,K線會改變顏色,以便快速辨識市場中的顯著變動。
最低低點期間:設定計算最低價格線的期間,用於判斷進場後的趨勢止盈位置。此支撐線能幫助交易者在趨勢中保護利潤。
ATR期數與倍數:ATR (平均真實範圍) 用於計算止損線,期數及倍數可調整,以便根據波動性設定更合適的止損範圍。
進場價位與USDT總量:用戶可以輸入預計的進場價位和總資金量,指標會根據風險控制自動計算建倉金額。風險控制是每筆交易僅損失5%的總資金,以更好地管理風險。
倍數 (槓桿):此參數允許用戶設置槓桿倍數,用於計算最終所需的資金。
表格功能
指標的表格功能在圖表上顯示進場價位、止損點和建倉金額。表格顏色清晰對比,提供了簡明的交易數據概覽,使交易者能夠快速查看並根據當前市場情況做出風險控制決策。
交易量支撐效果
此指標在異常交易量倍數達到特定條件時會標示不同顏色,表現出強烈的市場關注度。當交易量出現突增或高於SMA交易量的情況時,往往顯示出支撐或阻力的信號。特別在價格頂部或底部時,這些異常交易量常會產生支撐效果,暗示該區域可能形成穩固的價格支撐或阻力。
這款指標適合希望嚴謹管理風險的交易者,適用於日內和長期策略,並能提供穩定的市場監控信息。
English Description
All-Market Monitor is a versatile indicator providing traders with comprehensive market insights, including price trends, moving averages, volume analysis, and risk management. This indicator supports multiple adjustable parameters, allowing traders to configure the settings for more adaptable trading strategies.
Parameter Descriptions:
SMA Length Settings: Configurable lengths for seven different SMAs (Simple Moving Averages) to provide trend information across various time frames.
Volume Multiplier: Sets the multiplier for trading volume to highlight unusual volume spikes. When volume conditions meet specified criteria, the candles change colors for easy recognition of significant market moves.
Lowest Low Period: Defines the period for calculating the lowest price line, which serves as a trailing take-profit level after entry. This support line helps traders secure profits in a trending market.
ATR Period and Multiplier: The ATR (Average True Range) is used to calculate a dynamic stop-loss level. Adjustable period and multiplier provide flexibility in setting stop levels based on market volatility.
Entry Price and Total USDT: Allows input of the intended entry price and total capital in USDT. The indicator calculates the required position size based on a risk management rule, where each trade is limited to a maximum loss of 5% of total capital.
Leverage: Users can set the leverage multiplier, which adjusts the final required USDT for entry.
Table Feature
The table feature provides an on-chart display of entry price, stop-loss level, and required position size, with distinct colors for easy reference. This layout delivers a clear summary of key trading metrics, enabling traders to make risk-adjusted decisions in real time.
Volume Support Effect
When unusual volume spikes meet specific criteria, the indicator highlights candles with distinct colors, representing heightened market interest. These volume spikes often indicate support or resistance levels, especially at price peaks or troughs, where high volume can signal potential support effects, indicating that prices may hold within these regions due to strong buying or selling interest.
This indicator is ideal for traders focused on rigorous risk management, suitable for both intraday and long-term strategies, offering reliable market monitoring insights.

STANDARD DEVIATION INDICATOR BY WISE TRADERWISE TRADER STANDARD DEVIATION SETUP: The Ultimate Volatility and Trend Analysis Tool
Unlock the power of STANDARD DEVIATIONS like never before with the this indicator, a versatile and comprehensive tool designed for traders who seek deeper insights into market volatility, trend strength, and price action. This advanced indicator simultaneously plots three sets of customizable Deviations, each with unique settings for moving average types, standard deviations, and periods. Whether you’re a swing trader, day trader, or long-term investor, the STANDARD DEVIATION indicator provides a dynamic way to spot potential reversals, breakouts, and trend-following opportunities.
Key Features:
STANDARD DEVIATIONS Configuration : Monitor three different Bollinger Bands at the same time, allowing for multi-timeframe analysis within a single chart.
Customizable Moving Average Types: Choose from SMA, EMA, SMMA (RMA), WMA, and VWMA to calculate the basis of each band according to your preferred method.
Dynamic Standard Deviations: Set different standard deviation multipliers for each band to fine-tune sensitivity for various market conditions.
Visual Clarity: Color-coded bands with adjustable thicknesses provide a clear view of upper and lower boundaries, along with fill backgrounds to highlight price ranges effectively.
Enhanced Trend Detection: Identify potential trend continuation, consolidation, or reversal zones based on the position and interaction of price with the three bands.
Offset Adjustment: Shift the bands forward or backward to analyze future or past price movements more effectively.
Why Use Triple STANDARD DEVIATIONS ?
STANDARD DEVIATIONS are a popular choice among traders for measuring volatility and anticipating potential price movements. This indicator takes STANDARD DEVIATIONS to the next level by allowing you to customize and analyze three distinct bands simultaneously, providing an unparalleled view of market dynamics. Use it to:
Spot Volatility Expansion and Contraction: Track periods of high and low volatility as prices move toward or away from the bands.
Identify Overbought or Oversold Conditions: Monitor when prices reach extreme levels compared to historical volatility to gauge potential reversal points.
Validate Breakouts: Confirm the strength of a breakout when prices move beyond the outer bands.
Optimize Risk Management: Enhance your strategy's risk-reward ratio by dynamically adjusting stop-loss and take-profit levels based on band positions.
Ideal For:
Forex, Stocks, Cryptocurrencies, and Commodities Traders looking to enhance their technical analysis.
Scalpers and Day Traders who need rapid insights into market conditions.
Swing Traders and Long-Term Investors seeking to confirm entry and exit points.
Trend Followers and Mean Reversion Traders interested in combining both strategies for maximum profitability.
Harness the full potential of STANDARD DEVIATIONS with this multi-dimensional approach. The "STANDARD DEVIATIONS " indicator by WISE TRADER will become an essential part of your trading arsenal, helping you make more informed decisions, reduce risks, and seize profitable opportunities.
Who is WISE TRADER ?
Wise Trader is a highly skilled trader who launched his channel in 2020 during the COVID-19 pandemic, quickly building a loyal following. With thousands of paid subscribed members and over 70,000 YouTube subscribers, Wise Trader has become a trusted authority in the trading world. He is known for his ability to navigate significant events, such as the Indian elections and stock market crashes, providing his audience with valuable insights into market movements and volatility. With a deep understanding of macroeconomics and its correlation to global stock markets, Wise Trader shares informed strategies that help traders make better decisions. His content covers technical analysis, trading setups, economic indicators, and market trends, offering a comprehensive approach to understanding financial markets. The channel serves as a go-to resource for traders who want to enhance their skills and stay informed about key market developments.

Premium Signals with Dynamic TP & SL OptimizationThis algorithm is designed to generate buy and sell signals using two channels calculated from moving averages and price ranges 📊. The channels are configured with customizable periods and multipliers that adjust their width 🔄.
✨ Signals are generated when the price crosses and is confirmed on the second candle that exceeds the upper or lower limits of both channels 📉📈.
Once a buy or sell signal is confirmed, the indicator dynamically sets the levels of "Take Profit" (TP) and "Stop Loss" (SL), calculated based on the difference between the entry price and the maximum or minimum range reached in the last bars 📏. This allows the algorithm to adjust each chart signal with its own dynamic level, adapting to market conditions in real-time 🕰️.
🚀 Key Features:
1️⃣ Dynamic Channel Calculation 📊:
The channels adjust according to recent price action. Instead of relying solely on simple averages, the upper and lower limits of each channel are calculated using multipliers applied to the recent price range. This allows the channels to reflect changes in market volatility, expanding or contracting dynamically 🌐.
2️⃣ Dynamic TP and SL Optimization 🎯:
The TP and SL levels are automatically calculated after each signal, using adjustable percentages based on the amplitude of recent price ranges 📉.
3️⃣ Real-Time Tracking ⏱️:
The information table provides a quick view of the current operation status, facilitating decision-making 📋.
________________________________________
🧩 Confirmation Function:
Channel 2 (long-term) acts as a confirmation of Channel 1 (short-term). Signals are validated when the price crosses the limits of both channels simultaneously 🔄.
• Buy Signal 🟢: The price must close above the upper limits of both channels in at least two confirmed candles ✅.
• Sell Signal 🔴: The price must close below the lower limits of both channels in at least two confirmed candles ⛔.
________________________________________
🎯 1: Multi-Level Take Profit with Alerts 🔔:
This advanced Take Profit (TP) system calculates three distinct TP levels for each operation, dynamically set based on recent market movements and patterns 🌐.
➡️ Dynamic Calculation of TP Levels:
• The code generates three Take Profit levels: TP1, TP2, and TP3 🔢.
• These levels are calculated based on the most recent price range, multiplied by an adjustable factor that determines the distance at which each TP will be set 📐.
• The TP dynamically adapts based on market volatility 📊. If the market is more volatile, the TP levels will be wider; in contrast, in less volatile markets, the TP levels will be narrower 🔍.
➡️ TP Level Alerts 📲:
• The system generates automatic alerts when the price reaches each of the TP1, TP2, and TP3 levels 📢. This is useful for the trader to receive real-time notifications on how their trade is progressing 🕒.
• These alerts are fully customizable ✨. You can set specific alerts for each buy or sell signal, as well as individual alerts for each TP level.
________________________________________
🚫 2: Dynamic Stop Loss with Alerts 🔔:
The Stop Loss (SL) system is dynamically designed to adapt to market conditions, providing a smarter and more reactive risk management 🛡️.
➡️ Volatility-Based Stop Loss 📉:
• The SL level is dynamically calculated based on market volatility, adjusting as a percentage of the third Take Profit (TP3) level.
• By default, SL is set at 50% of the value of TP3. This parameter can be modified by the user to make it more conservative or aggressive ⚙️.
➡️ Market Adaptability 🌐:
• Since the SL is based on recent volatility, it automatically adjusts to be closer in low volatility markets or farther away in high volatility markets 🌪️. This helps reduce the likelihood of the SL being hit by minor fluctuations 🔄.
➡️ Stop Loss and Take Profit Alerts 🔔:
• In addition to the Take Profit alerts, the system also generates an alert when the price reaches the Stop Loss level ❌.
________________________________________
⚙️ Adjustable Parameters:
• Channel Periods 1 and 2: Adjust the length of the channels for different timeframes 📅.
• Channel Multipliers 1 and 2: Control the sensitivity of the channels to price movements 🔍.
• Price Source: Allows selection between close, open, high, low, etc. 📈.
• Stop Loss Ratio: Adjust the SL level as a percentage of Take Profit ⚖️.
________________________________________
💬 Support: For questions or support, leave a comment on this post. I will try to respond as soon as possible 📩.
⚠️ Risk Management Limitations: Although the script provides TP and SL levels, it does not include more sophisticated risk management features, such as adjusting position size according to market volatility 📉.
🕒 Recommended timeframes: 1D, 4H, 2H, 1H, and 30M ⏰.
Español:
Este algoritmo está diseñado para generar señales de compra y venta utilizando dos canales calculados a partir de promedios móviles y rangos de precios 📊. Los canales están configurados con períodos personalizables y multiplicadores que ajustan su amplitud 🔄.
✨ Las señales se generan cuando el precio cruza y se confirma en la segunda vela que supera los límites superiores o inferiores de ambos canales 📉📈.
Una vez que se confirma una señal de compra o venta, el indicador establece dinámicamente los niveles de "Take Profit" (TP) y "Stop Loss" (SL), calculados en base a la diferencia entre el precio de entrada y el rango máximo o mínimo alcanzado en las últimas barras 📏. Esto permite que el algoritmo ajuste cada señal del gráfico con su propio nivel dinámico, adaptándose a las condiciones del mercado en tiempo real 🕰️.
🚀 Características Clave:
1️⃣ Cálculo Dinámico de Canales 📊:
Los canales se ajustan de acuerdo con la acción reciente del precio. En lugar de depender únicamente de promedios simples, los límites superior e inferior de cada canal se calculan usando multiplicadores aplicados al rango reciente de precios. Esto permite que los canales reflejen cambios en la volatilidad del mercado, expandiendo o contrayéndose dinámicamente 🌐.
2️⃣ Optimización Dinámica de TP y SL 🎯:
Los niveles de TP y SL se calculan automáticamente tras cada señal, utilizando porcentajes ajustables basados en la amplitud del rango de precios recientes 📉.
3️⃣ Seguimiento en Tiempo Real ⏱️:
La tabla informativa ofrece una visión rápida del estado de la operación actual, facilitando la toma de decisiones 📋.
________________________________________
🧩 Función de Confirmación:
El Canal 2 (largo plazo) actúa como confirmación del Canal 1 (corto plazo). Las señales se validan cuando el precio atraviesa los límites de ambos canales simultáneamente 🔄.
• Señal de Compra 🟢: El precio debe cerrar por encima de los límites superiores de ambos canales en al menos dos velas confirmadas ✅.
• Señal de Venta 🔴: El precio debe cerrar por debajo de los límites inferiores de ambos canales en al menos dos velas confirmadas ⛔.
________________________________________
🎯 1: Take Profit Multinivel con Alertas 🔔:
Este sistema avanzado de Take Profit (TP) calcula tres niveles distintos de TP para cada operación, establecidos de manera dinámica según los movimientos y patrones recientes del mercado 🌐.
➡️ Cálculo Dinámico de Niveles de TP:
• El código genera tres niveles de Take Profit: TP1, TP2 y TP3 🔢.
• Estos niveles se calculan en función del rango de precio más reciente, multiplicado por un factor ajustable que determina la distancia en la que se colocará cada TP 📐.
• El TP se adapta dinámicamente según la volatilidad del mercado 📊. Si el mercado es más volátil, los niveles de TP serán más amplios; en contraste, en mercados con menor volatilidad, los niveles de TP serán más ajustados 🔍.
➡️ Alertas por Nivel de TP 📲:
• El sistema genera alertas automáticas cuando el precio alcanza cada uno de los niveles de TP1, TP2 y TP3 📢. Esto es útil para que el trader reciba notificaciones en tiempo real sobre cómo se está desarrollando su operación 🕒.
• Estas alertas son completamente personalizables ✨. Puedes configurar alertas específicas para cada señal de compra o venta, así como alertas individuales para cada nivel de TP.
________________________________________
🚫 2: Stop Loss Dinámico con Alerta 🔔:
El sistema de Stop Loss (SL) está diseñado de manera dinámica para adaptarse a las condiciones del mercado, proporcionando una gestión de riesgo más inteligente y reactiva 🛡️.
➡️ Stop Loss Basado en la Volatilidad 📉:
• El nivel de SL se calcula dinámicamente en función de la volatilidad del mercado, ajustándose como un porcentaje del tercer nivel de Take Profit (TP3).
• Por defecto, el SL se establece en un 50% del valor de TP3. Este parámetro puede ser modificado por el usuario para hacerlo más conservador o agresivo ⚙️.
➡️ Adaptabilidad al Mercado 🌐:
• Dado que el SL está basado en la volatilidad reciente, se ajusta automáticamente para que esté más cerca en mercados de baja volatilidad o más lejos en mercados de alta volatilidad 🌪️. Esto ayuda a reducir la probabilidad de que el SL sea alcanzado por fluctuaciones menores 🔄.
➡️ Alertas de Stop Loss y Take Profit 🔔:
• Además de las alertas por niveles de Take Profit, el sistema también genera una alerta cuando el precio alcanza el nivel de Stop Loss ❌.
________________________________________
⚙️ Parámetros Ajustables:
• Período de los Canales 1 y 2: Ajusta la longitud de los canales para diferentes marcos de tiempo 📅.
• Multiplicador de los Canales 1 y 2: Controla la sensibilidad de los canales a los movimientos del precio 🔍.
• Fuente del Precio: Permite la selección entre cierre, apertura, máximo, mínimo, etc. 📈.
• Proporción de Stop Loss: Ajusta el nivel de SL como un porcentaje del Take Profit ⚖️.
________________________________________
💬 Soporte: Para preguntas o soporte, deja un comentario en esta publicación. Intentaré responder lo antes posible 📩.
⚠️ Limitaciones en la Gestión de Riesgos: Aunque el script proporciona niveles de TP y SL, no incluye una gestión de riesgos más sofisticada, como el ajuste del tamaño de la posición según la volatilidad del mercado 📉.
🕒 Marcos de tiempo recomendados: 1D, 4H, 2H, 1H y 30M ⏰
